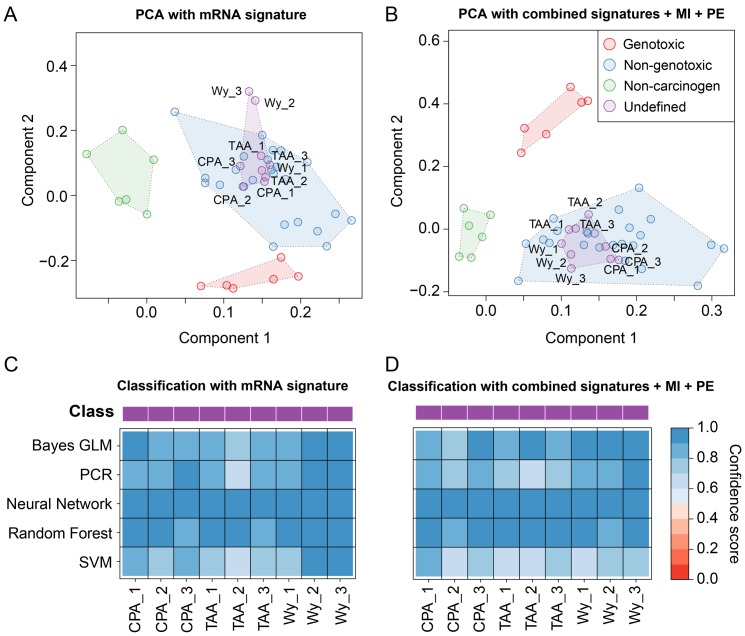
Figure 7. Classification of undefined compounds.
(A) Samples are represented based on the protein signature for NGC vs. GC discrimination. The corresponding fold changes were PCA-transformed and plotted in a lower-dimensional space spanned by the first two principal components. The color of the spheres corresponds to the class of the administered compounds with respect to their hepatocarcinogenic properties in rats. Clusters of rat liver samples after treatment of rats with compounds of the same class are highlighted by means of transparent polygons. (B) Similar plot as in (A), but instead of using the protein signature for sample representation, all single-platform (mRNA, miRNA, protein) and cross-platform signatures (PE, MI) were combined. (C) The heatmap displays the confidence scores obtained from five different machine learning methods that were used to classify the undefined compounds CPA, TAA, and WY as either NGC or GC. The confidence scores are [0, 1]-scaled and correspond to the probability that a certain sample was treated with an NGC (see color key). (D) Similar illustration as in (C) obtained from an SVM classifier trained on all signatures combined.

