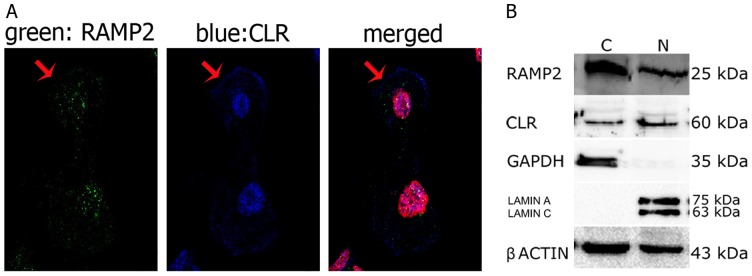
Figure 5. RAMP2 and CLR distribution in cultured TECs.

(A) Immunofluorescence staining of TECs for RAMP2 (green) and CLR (blue). RAMP2 is evident inside the cell nucleus and cytoplasm, whereas CLR appears widespread in TECs, showing immunoreaction in nuclei, cytosol and cell membranes (arrow). Cell nuclei are red stained with propidium iodide. When, for control purposes, the primary antibody was replaced by a non-immune PBS solution, no reactivity could be observed (not shown in the figure). (B) A typical western blot analysis of RAMP2 and CLR. Protein expression was analyzed in the cytoplasmic (C) and nuclear (N) fractions of TECs. GAPDH and Lamin A/C were used as cytoplasmic and nuclear markers, respectively, to exclude contamination during cell fraction isolation. β-actin was used as loading control.
