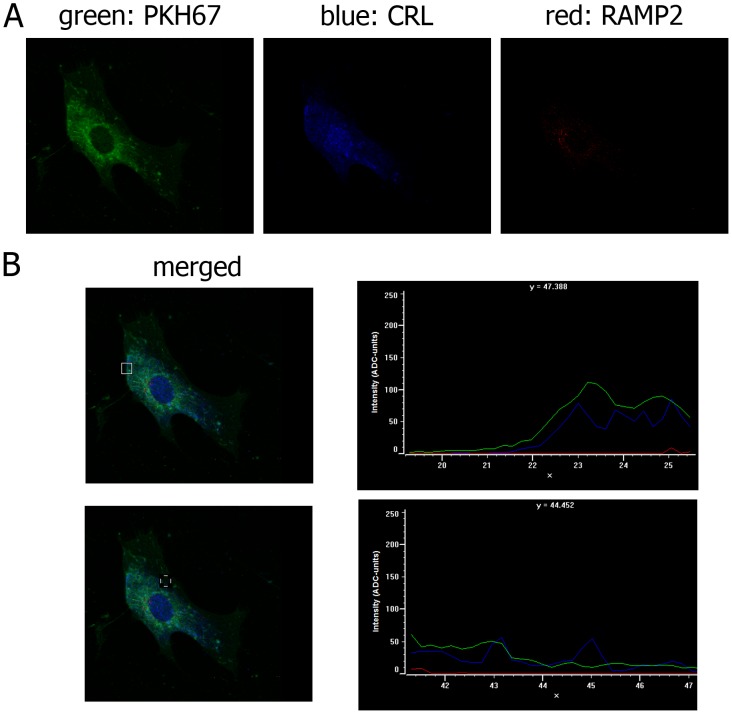
Figure 6. PKH67, CLR and RAMP2 distribution in cultured TECs.
(A) Immunofluorescence staining of TECs for the plasma membrane marker PKH67 (green), CRL (blue) and RAMP2 (red). When, for control purposes, the primary antibody was replaced by a non-immune PBS solution, no reactivity could be observed (not shown in the figure). (B) Distribution of fluorescence intensity (ADC units) of PKH67 (green), CLR (blue) and RAMP2 (red) in two distinct plasma membrane regions (indicated by a square).

