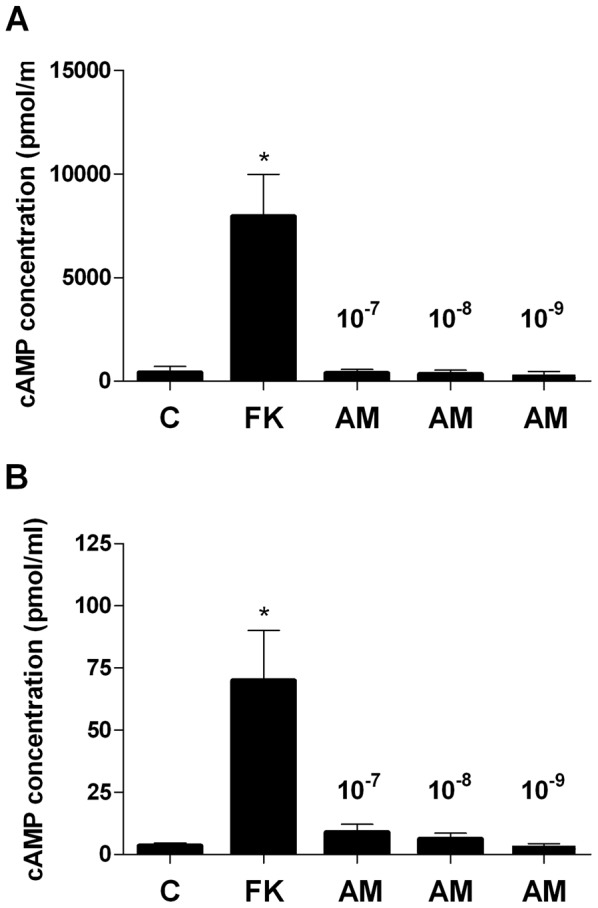
Figure 9. cAMP production in thymic cells.

cAMP levels in TECs (A) and thymocytes (B) after exposure to AM or forskolin (FK). TECs and thymocytes were incubated with increasing concentrations of AM (ranging from 10−9 to 10−7). 10−4 FK was used as positive control. Values are means ± SD (n = 3). *P<0.05 vs control (C).
