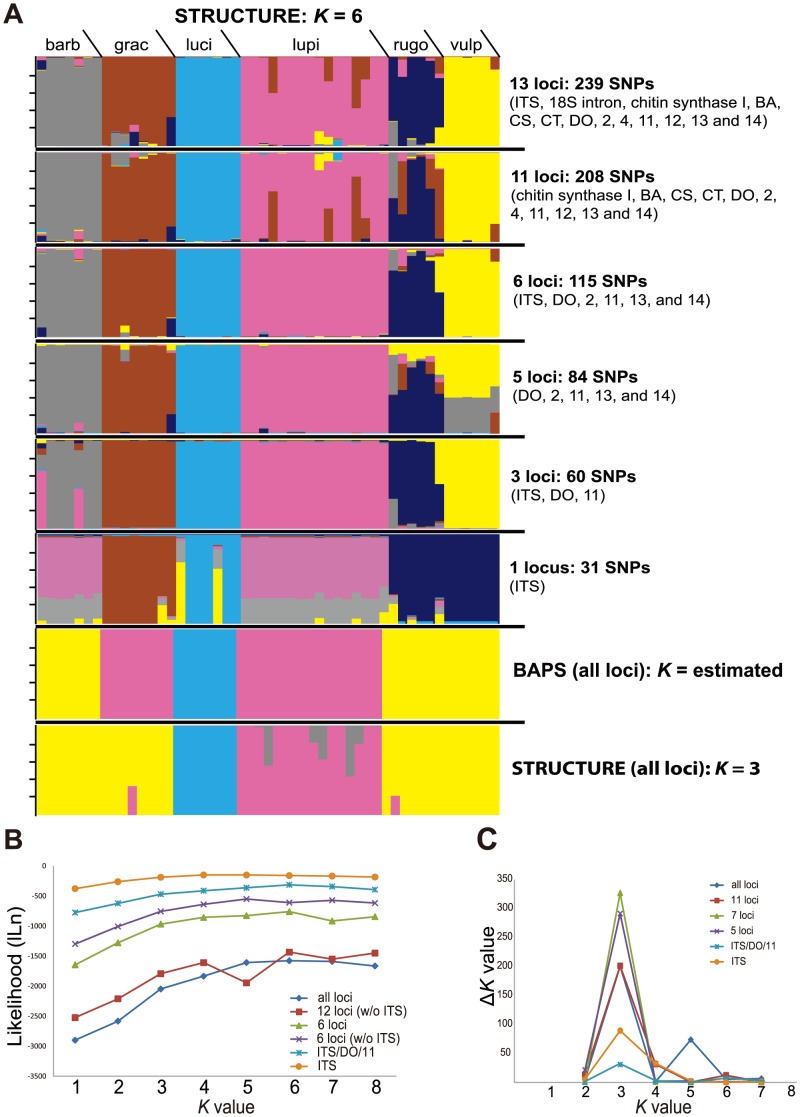
Figure 2. Results from Bayesian clustering analyses of 51 Letharia specimens from [18].
A. Individual assignments within population clusters in Letharia inferred using the Program BAPS and STRUCTURE; vertical bars represent individual assignment probability into different genetic clusters depicted with colors; the six uppermost panels depict individual population assignments under a variety of combinations of SNP data using a K = 6 model; and the lower two panels depict individual assignments inferred using BAPS (estimating the number of genetic clusters) and the K = 3 model from the STRUCTURE analysis (based on results from the ad hoc statistic ΔK); and order of individuals is identical across panels. B. Plot of mean likelihood values for each K (1–8), based on 10 replicates per K, from the STRUCTURE analysis of the sampled Letharia specimens. C. Results from the ΔK analysis, following Evanno et al. [51]; the modal value of this distribution is the uppermost level of structure (K).

