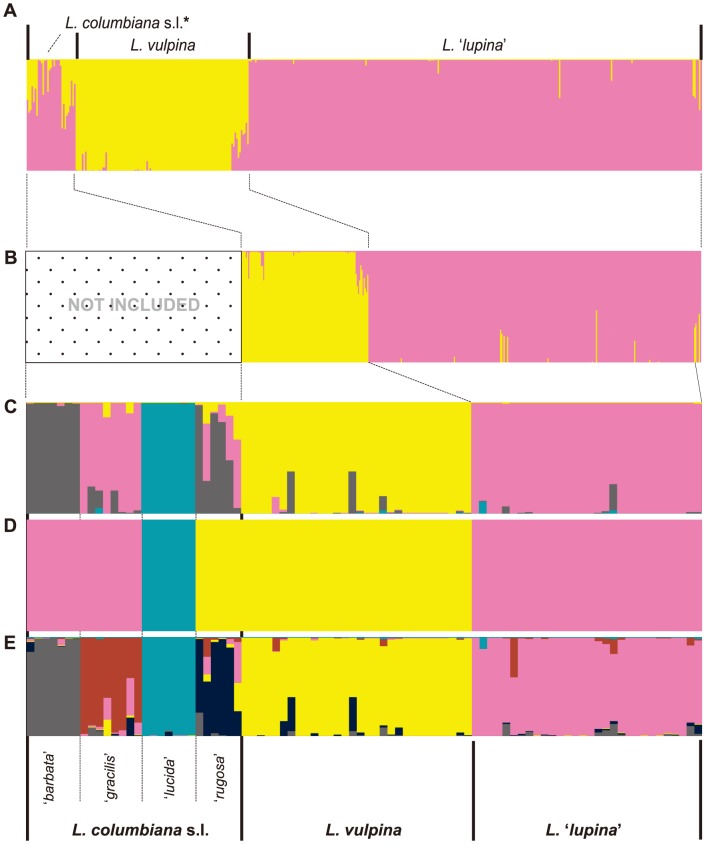
Figure 4. Results from Bayesian clustering analyses of Letharia samples under a variety of scenarios.
Vertical bars represent individual assignment probability into different genetic clusters depicted with colors. A. Individual population assignments based on the STRUCTURE analysis of 432 Letharia specimens inferred under the K = 2 model based results from the ad hoc statistic ΔK (identical to the top panel in Fig. 3A). B. Individual population assignments based on the STRUCTURE analysis excluding specimens representing L. columbiana s.l. and strictly representing sorediate forms L. ‘lupina’ and L. vulpina, inferred under the K = 2 model based results from the ad hoc statistic ΔK (see Supplementary Fig S1). C. Individual population assignments inferred under the K = 4 model from the STRUCTURE analysis (based on results from the ad hoc statistic ΔK; Supplementary Fig S2) in the dataset with normalized sample sizes for the two sorediate clusters. D. Individual assignments inferred using BAPS (estimating the number of genetic clusters) from the dataset with normalized sample sizes for the two sorediate clusters. E. Individual population assignments inferred under the K = 6 model from the STRUCTURE analysis (based on previous hypothesis of six species-level lineage in Letharia) from the dataset with normalized sample sizes for the two sorediate clusters. Order of individuals is identical across panels.

