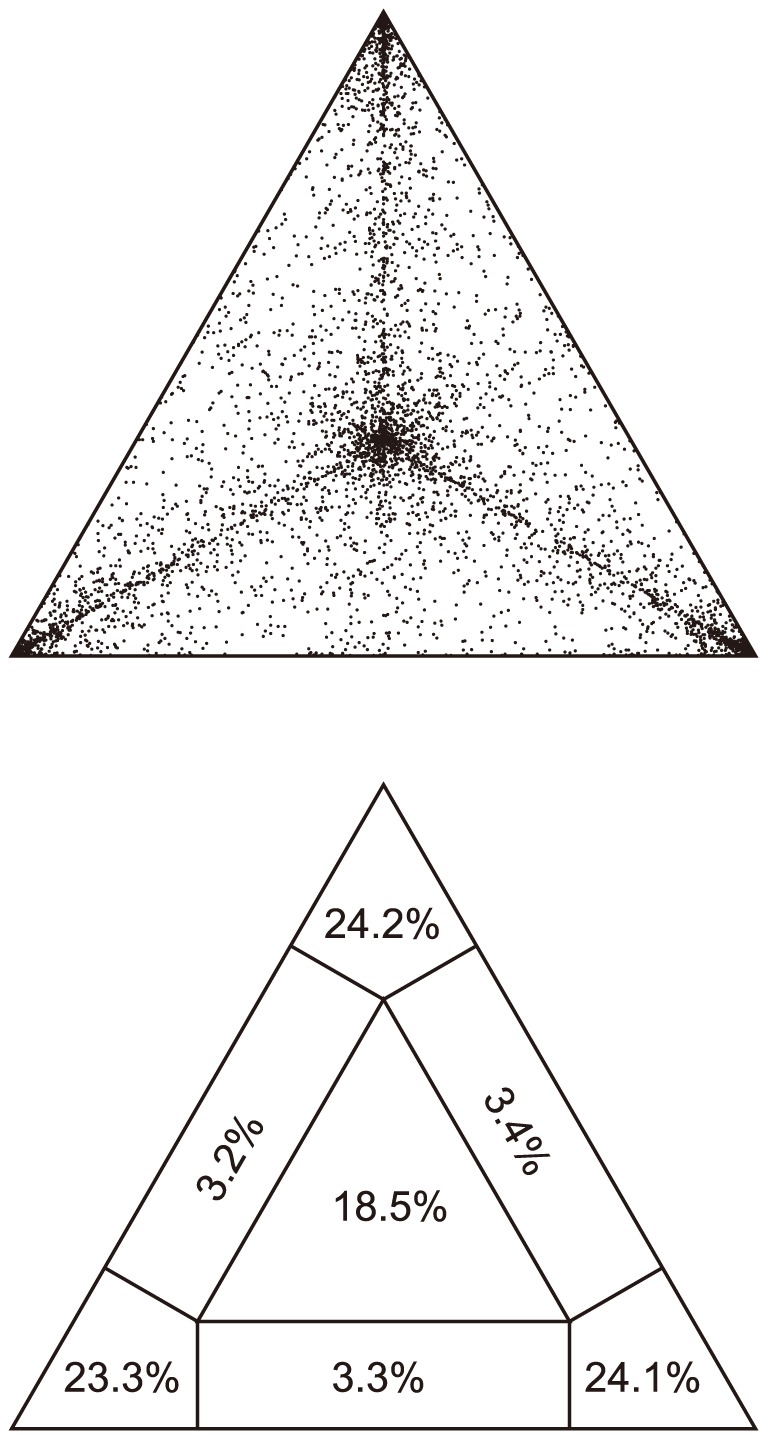
Figure 5. Likelihood mapping analysis of the concatenated 15-locus dataset from 432 Letharia samples.

Upper panel shows the distribution pattern of all quartets and the lower panel depicts the fraction of each occupied region. The values in the panels indicated proportion of fully resolved (corners), partially resolved (along the sides), and fully unresolved quartets (in the center).
