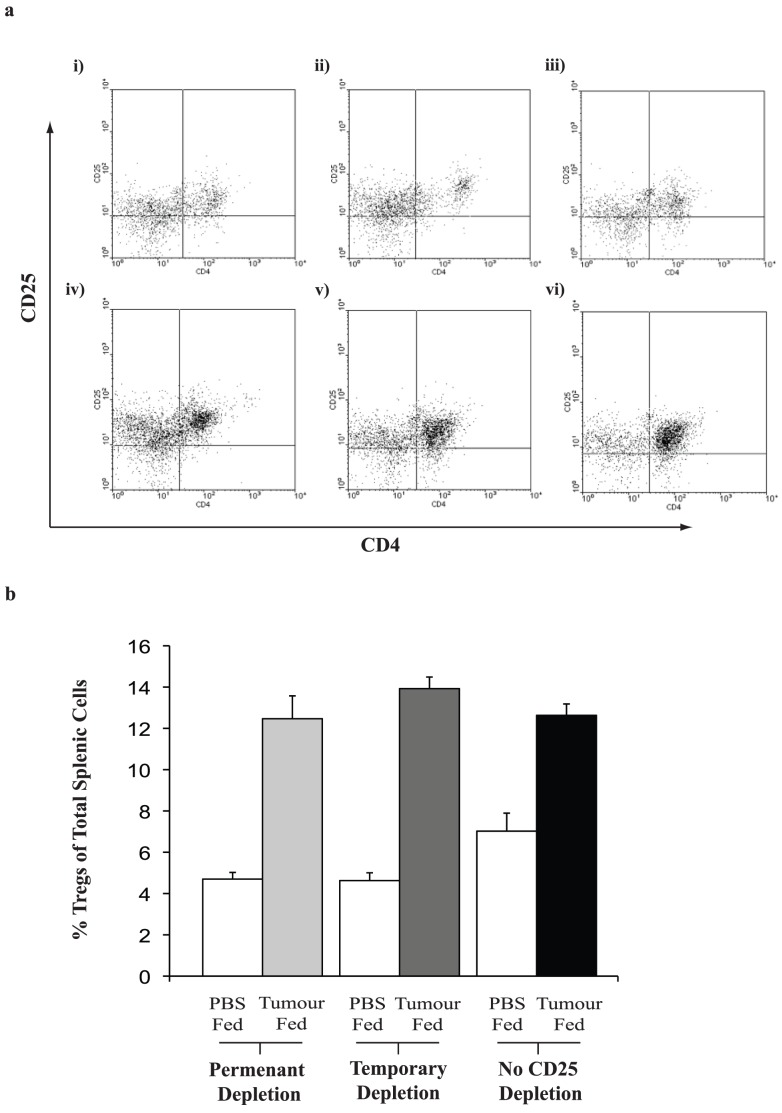
Figure 5. Splenic Tregs following feeding and Ab therapy.
(a) Cells were stained for CD3, CD4 and CD25. The cells were initially gated on CD3 and subsequently on CD4+CD25+. Splenic Tregs were analysed from mice which had been treated with (i) isotype control antibody followed by PBS feeding; (ii) temporarily depleted with anti-CD25 antibody but PBS fed (iii) permanently depleted with anti-CD25 antibody and PBS fed; (iv) isotype control antibody treatment and tumour fed, (v) temporarily depleted with anti-CD25 but tumour fed or (vi) permanently depleted and tumour fed. Representative dot plots from relevant groups are shown, three mice from each treatment group were analysed; (b) Graph representing the mean data from the dot plots in (a). There is a significant difference between those mice that were tumour fed or PBS fed and permanently depleted with anti-CD25 (p<0.01), depletion during tolerisation while PBS or JBS fed (p<0.001), control Ab, tumour fed versus control Ab, PBS fed (p<0.01). There was a significant difference between those mice that were treated with control Ab or PBS fed and those that were treated with anti-CD25 Ab at any time and PBS fed, (p<0.05). There was no significant difference in Tregs between any of those mice that were tumour fed across the treatment groups.

