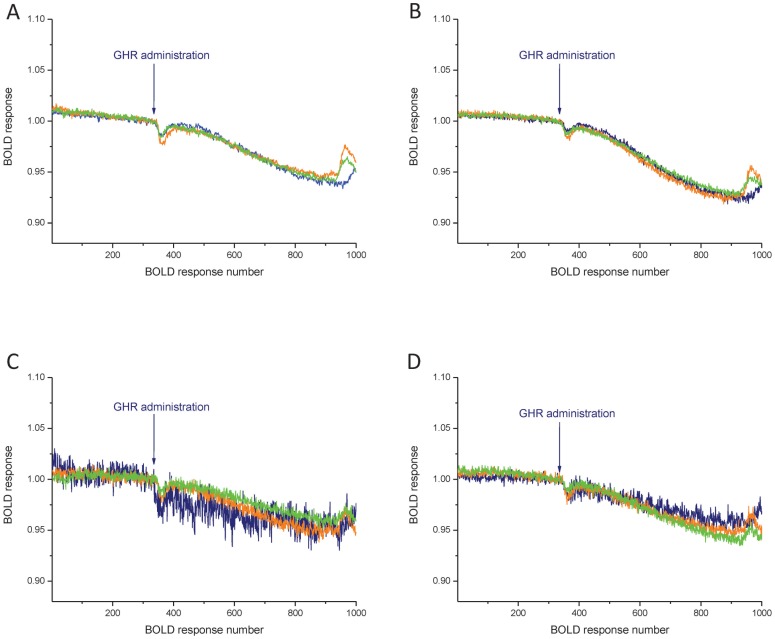
Figure 4. Mean of time response curves of ghrelin's effect on the BOLD responses in the prefrontal cortex (A), nucleus accumbens (B), ventromedial nucleus (C) and paraventricular nucleus (D), in males (blue), ovariectomized females (orange) and ovariectomized females treated with E2 (green).
Arrows mark ghrelin administration, which started at BOLD response 333 and lasted to 383 (999–1149 s). For quantifying drug effect mean of the BOLD responses from 901 to 950 was calculated (2703–2850 s). N = 11–14.

