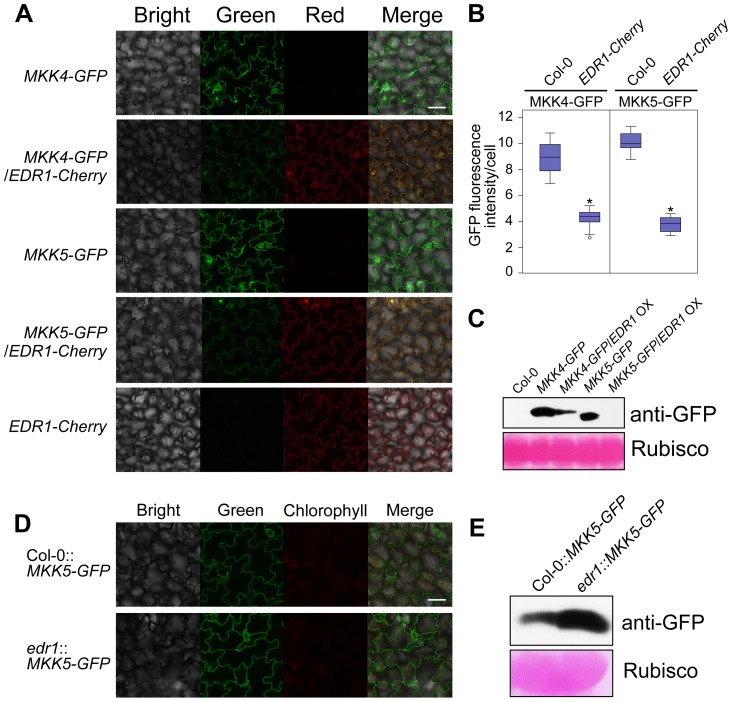
Figure 5. EDR1 regulates the protein levels of MKK4 and MKK5.
(A) GFP and Cherry fluorescence of seedlings of transgenic plants that express MKK4-GFP or MKK5-GFP alone or with EDR1-Cherry, was detected by confocal microscopy using the same parameters. Bar = 50 µm. (B) The GFP fluorescence intensity was quantified by using ImageJ software. 30 cells from 10 independent leaves of each transgenic plant were used for the quantification of the intensity of GFP fluorescence. The results are shown as a box plot graph. Asterisks represent statistically significant differences (P<0.05, Student's t-test). (C) Immunoblot was performed for each sample using anti-GFP antibody. The large subunit of Rubisco is shown as a protein loading control. (D) GFP fluorescence of seedlings of transgenic plants Col-0::MKK5-GFP and edr1::MKK5-GFP was detected by confocal microscopy using the same parameters. Bar = 50 µm. (E) Immunoblot was performed for Col-0::MKK5-GFP and edr1::MKK5-GFP using anti-GFP antibody. The large subunit of Rubisco is shown as a protein loading control.

