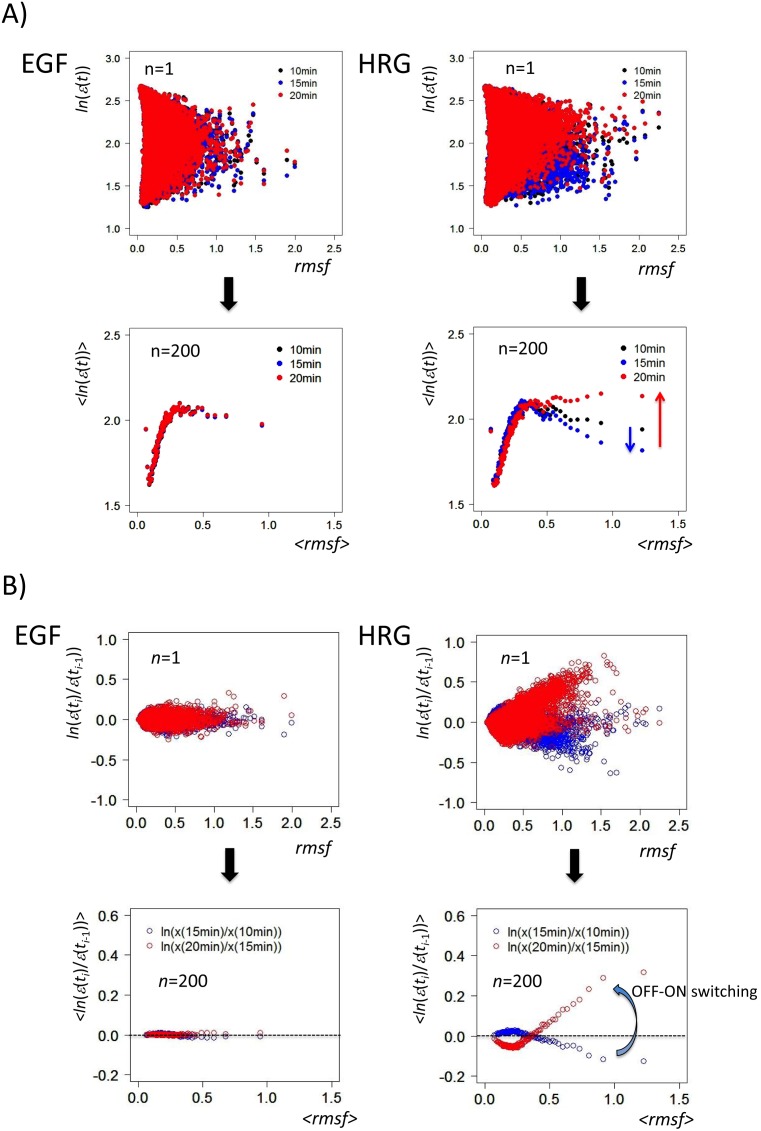
Figure 1. Emergence of biphasic dynamic emergent averaging behaviors (DEABs) of the expression and the expression change.
The transition from scattered expression (first row; N = 22035) to time-dependent correlation (second row) is shown as the collective behavior of ensemble groups: DEAB of A) the expression (symbolically represented by ln(ε(t)); called simply ‘the expression’) and B) the expression change (ln(ε(ti)/ε(ti –1))). The image shows biphasic genomic responses (biphasic statistics) to HRG and EGF; plots of single mRNA (n = 1; first row) and a group of genes (n = 200; second row) for A) the expression at t = 10 min (black dot), 15 min (blue), and 20 min (red), and B) the expression change from ti –1 = 10 min to ti = 15 min (blue cycle) and from ti –1 = 15 min to ti = 20 min (red), reflects OFF-ON switching down- to up-regulation). Brackets around x, <x>, reflect the simple arithmetic mean of x in a group (n = 200).

