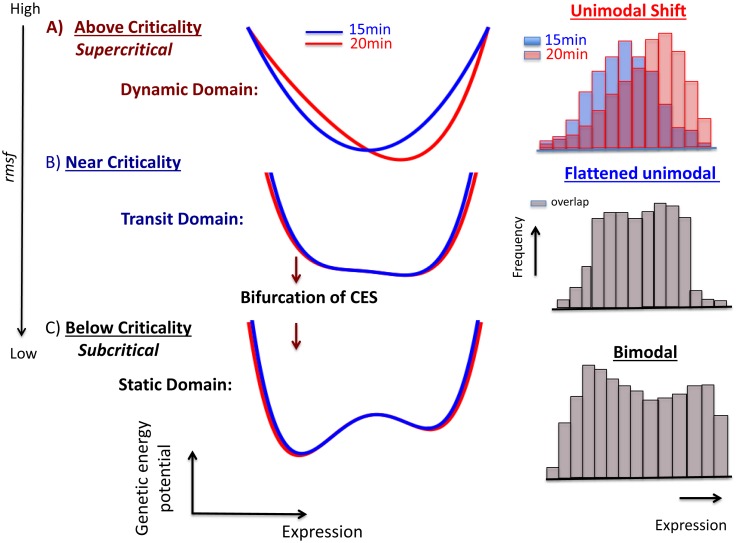
Figure 8. Schematic illustration of genetic criticality in DEAB of the expression.
The putative genetic energy potential (15 min: blue; 20 min: red) with a fixed change in the expression (see the main text) describes the arrangement of mRNA expression in a transcriptional system, where the profile of the potential is anticipated from the scaling exponent of the frequency distribution of the expression (histograms: right panel; blue: 15 min; red: 20 min; gray: overlapped). The potential profile follows a change from single-well to double-well through a flattening profile as the rmsf is decreased (black arrow). The picture exhibits genetic criticality (details in Table 1 and File S1) as interpreted by the Landau theory [28] on characteristic expression domains for the HRG genomic response: dynamic (dark red), transit (dark blue), and static (black) domains represent above-, near- and below-criticality, respectively. In the above-criticality, due to the unimodal to bimodal shift of the frequency distribution (see also Figure 6A), the energy potential should also be shifted; in the near-criticality and below-criticality due to the overlapping frequency distributions between 15 min and 20 min, the energy potential should be (almost) temporally invariant. Note that, in the double-well potential (below-criticality), instead of generating two independent Boltzmann distributions (two equilibrium states), the frequency distribution shows broken distributions, which suggests non-linear interaction between coherent expression states in a non-equilibrium system.

