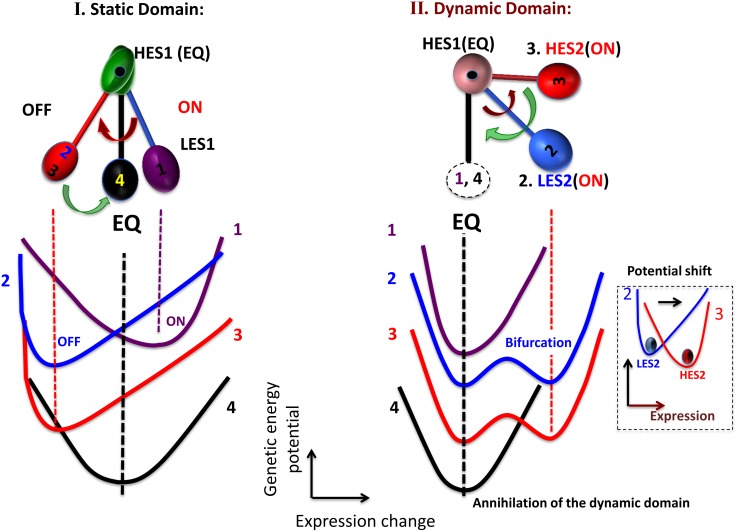
Figure 9. Schematic illustration of autonomous bistable switch (ABS) with genetic ‘energy profile’ in DEAB of the expression change.
First row: the schematic illustration depicts the temporal development of ABS showing the opposite changes of pendulum oscillation of CES between the static and dynamic domains (refer to Figure 7). In the HRG static domain (left panel), the temporal change of CES (LES1) occurs without the bifurcation of CES; in the dynamic domain (right), the pendulum oscillation occurs through the dynamic bifurcation of CES: bifurcation of a low-expression state with a change in a putative potential profile from single- to double-well at 15 min, a change from the low- to the high-expression state at 20 min (refer to Figure 6A) with a single-well potential shift (small dashed box), and annihilation of the high-expression state with a change from double- to single-well at 20–30 min. Second row: schematic illustration describes the dynamics of the genetic energy potential as a function of the expression change (with a fixed expression; see details in the main text): 1. purple line: 10–15 min (at 15 min); 2. blue: 15–20 min (at 15 min); 3. red: 15–20 min (at 20 min); 4. black: 20–30 min (at 30 min). The picture shows the energy flow between the pendulum motions, which reflects the non-equilibrium dynamics of CES.

