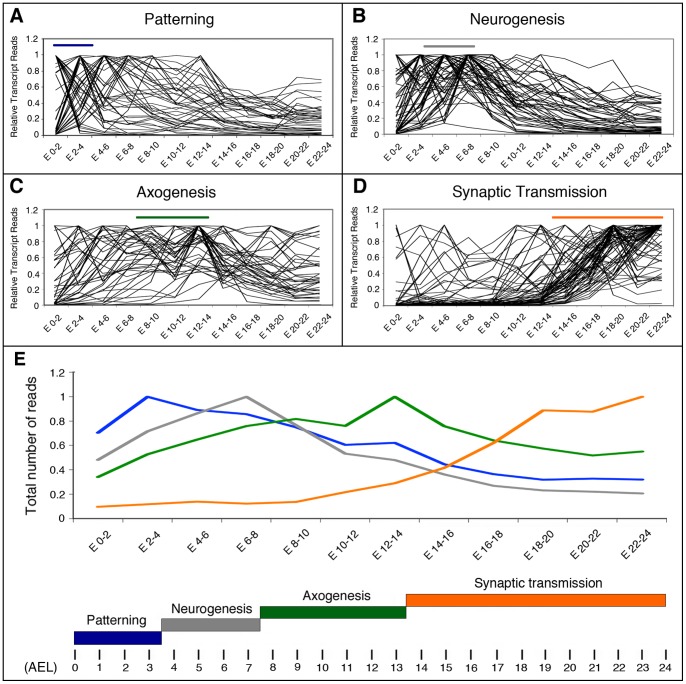
Figure 3. Transcriptional profiles of genes involved in early development and late differentiation of neurons in Drosophila.
A–D: Graphical representation of the expression profiles of individual genes within the indicated sub-catalogues during the specified developmental intervals. Transcriptome data are from Graveley et al. [5]. Horizontal bars show the developmental time when these processes take place following the color code indicated below. E: The total number of transcript reads of the genes belonging to the Patterning, Neurogenesis, Axogenesis or Synaptic Transmission sub-catalogues was plotted versus the indicated developmental times in a 0 to 1 scale. Bellow, the developmental times when these processes take place are indicated along a time scale of 24 hours. AEL: after egg laying.

