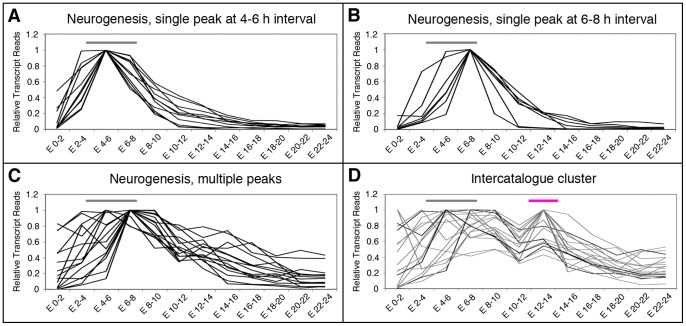
Figure 4. Expression profiles of the genes from the Neurogenesis sub-catalogue.
A–D: Graphical representation of the three types of expression profiles found for genes from the Neurogenesis sub-catalogue, represented in a 0 to 1 scale. Gene profiles of the type “Single peak of expression at the 4–6 hours AEL interval”, “Single peak of expression at the 6–8 hours AE interval” and “Multiple peaks of expression” are illustrated in A, B, and C, respectively. D: Several of the genes with multiple peaks of expression, show a second peak at the 12–14 hours AEL interval, as several others genes from the Patterning and Axogenesis sub-catalogues (Figure 3). The grey horizontal bars in A, B and C indicate the developmental time when Neurogenesis takes place. The pink horizontal bar in E indicates the 12–14 hours AEL interval. Transcriptome data from Graveley et al. [5] were used for the analysis.

