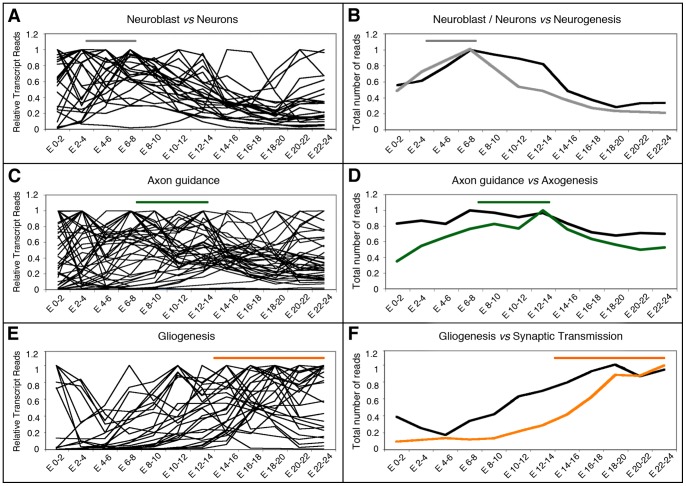
Figure 5. Expression profiles of functionally related genes compared with the Neurogenesis, Axogenesis and Synaptic Transmission sub-catalogues.
A, C, E: Graphical representation of the expression profiles of individual genes from functional catalogues defined experimentally in studies designed to identify genes with differential expression profiles in neurons vs neuroblasts [36] (A, B), axonal guidance [37] (C, D) and glial cells [38] (E, F). B, D, F: The total number of transcript reads of the genes selected experimentally (black lines) were plotted versus the specified developmental intervals represented in a 0 to 1 scale and compared with the total number of transcript reads of genes from the Neurogenesis, Axogenesis or Synaptic Transmission sub-catalogues. Lines have the same color code as in Figure 3. Horizontal bars indicate the developmental time when these processes take place following the color code as in Figure 3. Transcriptome data from Graveley et al. [5] were used for the comparison.

