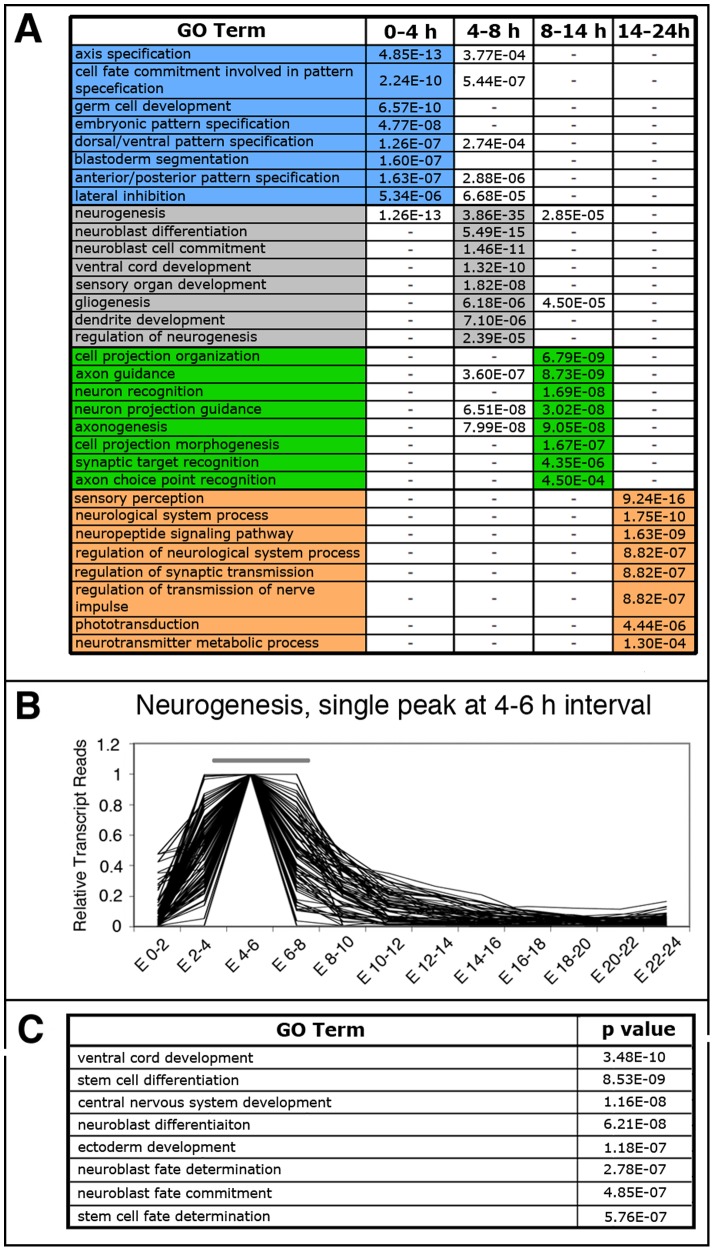
Figure 6. GO term enrichment analysis and functional prediction.
A: GO terms enriched in the specified developmental intervals. Color code is as in Figure 3. P values are indicated, the lowest one per GO term are colour-highlighted. (-) indicates that no significant enrichment was found. B: Graphical representation of 81 genes selected from the whole Drosophila genome using data from Graveley et al. [5] based on their transcriptional profiles, having a single peak in the 4–6 hours AEL interval in a 0 to 1 scale. C: GO terms enriched the list of genes plotted in B. P values are indicated.

