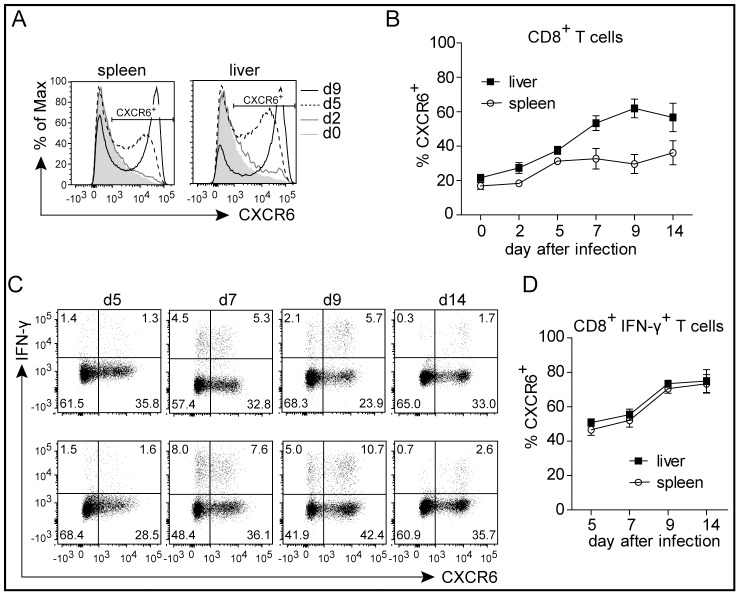
Figure 1. CXCR6 expression on CD8+ T cells during L. monocytogenes infection.
CXCR6+/GFP mice were infected with 1×10⁴ LmOVA i.v. and cells from spleens and livers were analyzed at indicated time points. (A) Representative histogram of CXCR6 expression by CD8+ T cells. (B) Expression of CXCR6 by CD8+ T cells. (C) Representative dot plots of CXCR6 and IFN–γ expression by CD8+ T cells. Upper row: spleen, lower row: liver (D) Expression of CXCR6 by IFN–γ+ listeria-specific CD8+ T cells. Symbols in (B) and (D) give the mean ± SEM, n≥5 and are representative for two experiments.

