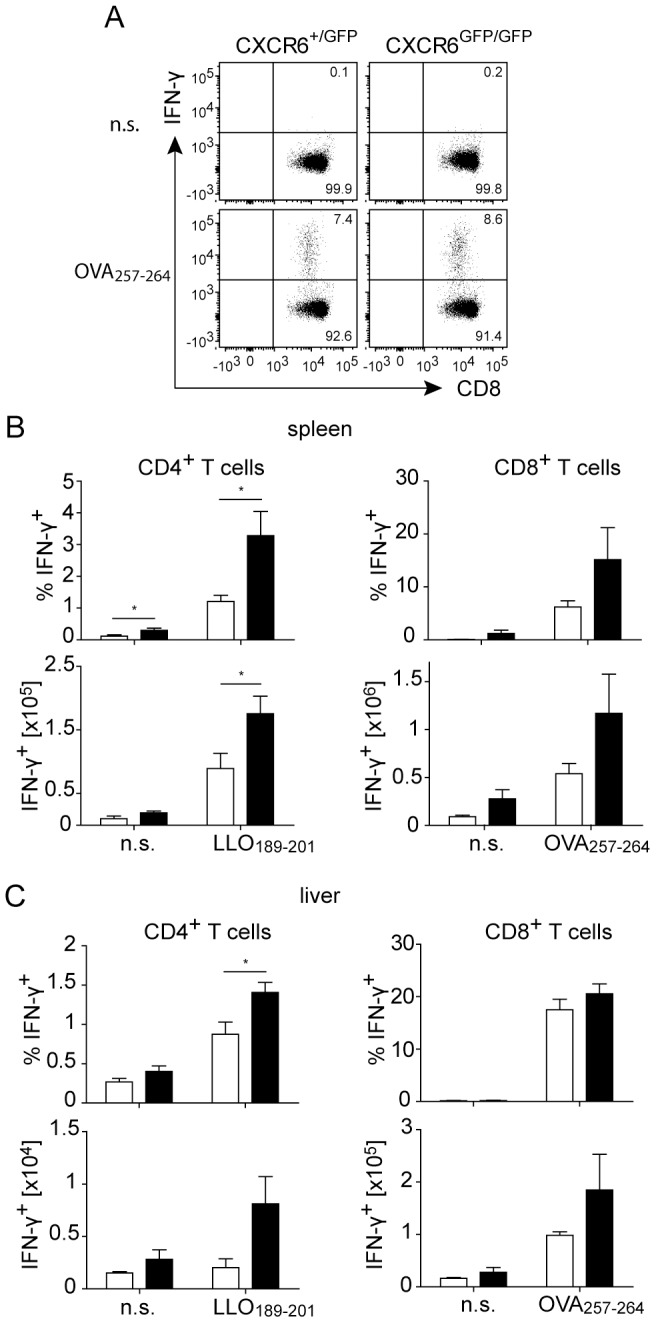
Figure 3. T cell responses of CXCR6-deficient mice against L. monocytogenes.

CXCR6+/GFP and CXCR6GFP/GFP mice were infected with 1×10⁴ LmOVA i.v. and spleens and livers were analyzed eight days p.i. Cytokine production was measured after stimulation of cells with LLO189-201 (CD4+ T cells) and OVA257-265 (CD8+ T cells). (A) Representative dot plots of IFN–γ expression in CD8+ T cells from spleen. Numbers show percentages of positive cells. (B, C) Percentages and numbers of IFN–γ+ CD4+ and IFN–γ+ CD8+ T cells in spleens and livers of infected CXCR6+/GFP (white bars) and CXCR6GFP/GFP (black bars) mice. Bars give mean ± SEM, n≥5. The experiment was repeated twice with consistent results. n.s., not stimulated; *, p<0.05.
