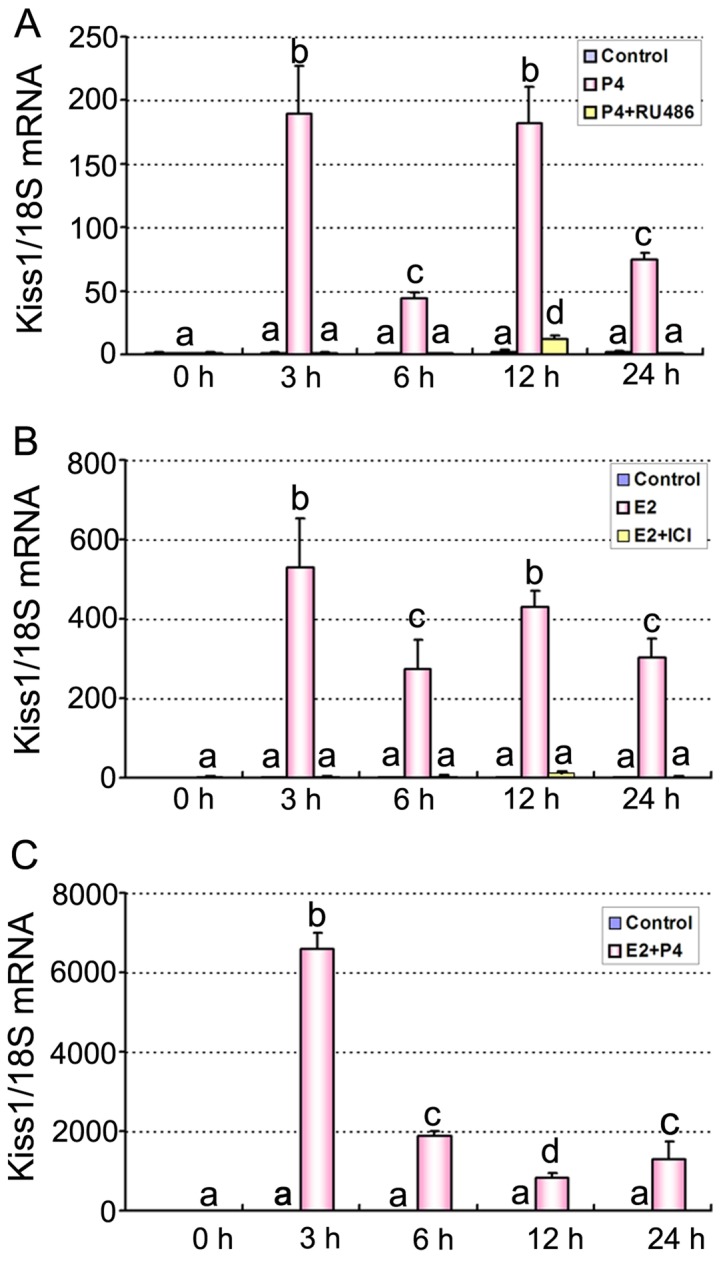
Figure 4. Quantitative PCR analysis of Kiss1 mRNA in mouse uteri after steroid hormone treatments.

(A) Expression of Kiss1 mRNA in mouse uteri at 0, 3, 6, 12, and 24 h after P4 plus RU486 treatment. (B) Expression of Kiss1 mRNA in mouse uteri at 0, 3, 6, 12, and 24 h after E2 plus ICI 182780 treatment. (C) Expression of Kiss1 mRNA in mouse uteri at 0, 3, 6, 12, and 24 h after P4 plus E2 treatment. Mice injected with oil (vehicle) served as controls. Data are shown as means ± SEM (n = 3). Groups with different superscript letters are significantly different (ANOVA followed by LSD multiple range test).
