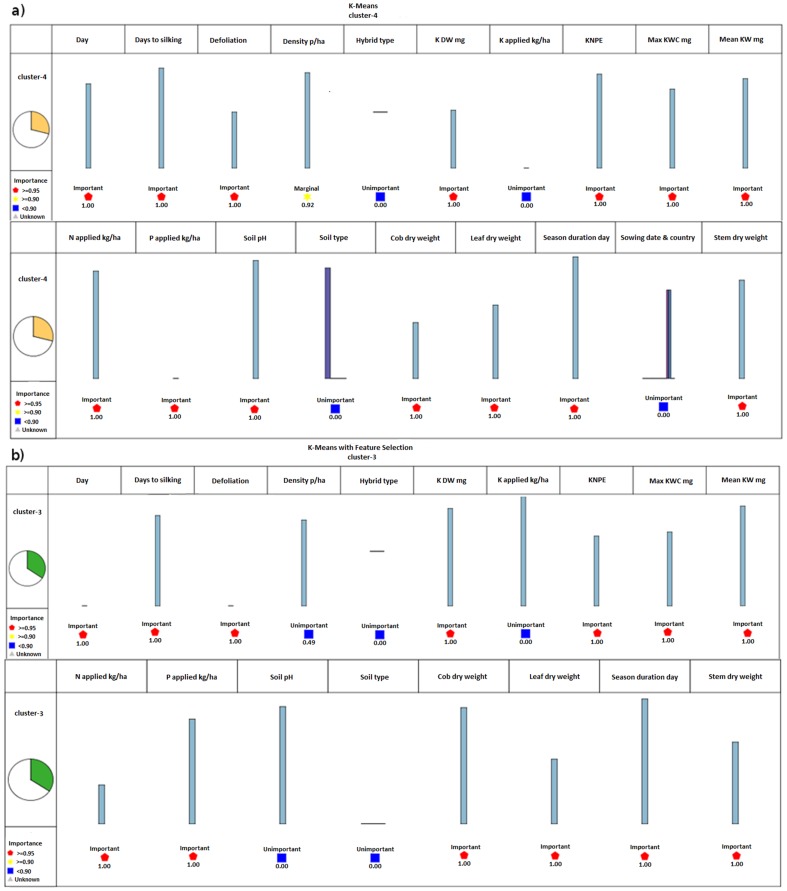
Figure 1. Comparison of the filtering of dataset with feature selection algorithm based on K-Means model.
(a) Most important generated cluster without feature selection filtering, cluster 4. (b) Most important generated cluster with feature selection filtering, cluster 3. 3. When K-Means model was applied on data filtered with feature selection, the records were put into 5 groups or clusters. When the model was applied on dataset without feature selection filtering, again five clusters were generated. In this clustering model, more than 28% of the records were put into the fourth cluster when the K-Means model was applied on the dataset without feature selection (Fig. 1a). When the K-Means model was applied on the dataset with feature selection filtering, more than 34% of the records were put into the third cluster (Fig. 1b). The number of iteration declined from 5 to 4 when feature selection applied on dataset.

