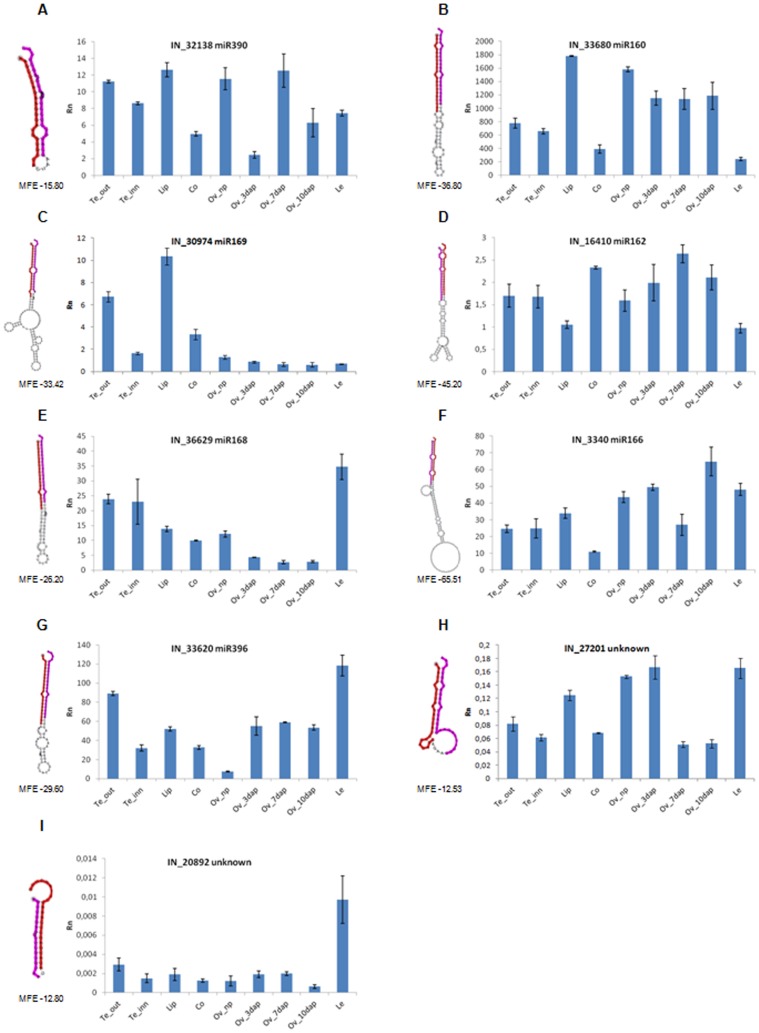
Figure 6. Relative expression pattern of selected conserved and putative novel miRNAs in different tissues of O. italica.
The predicted structure of the pre-miRNA is reported on the left of each graph, where the miRNA and miRNA* sequences are shown in red and pink, respectively. MFE, minimum free energy; Rn, relative expression ratio; Te_out, outer tepal; Te_inn, inner tepal; Co, column; Ov_np, not pollinated ovary; Ov_3dap, Ov_7dap, Ov_10dap, ovary 3, 7 and 10 days after pollination, respectively; Le, leaf. Bars indicate the standard deviation.

