
Figure 6. Heterozygous read ratio vs. read coverage.
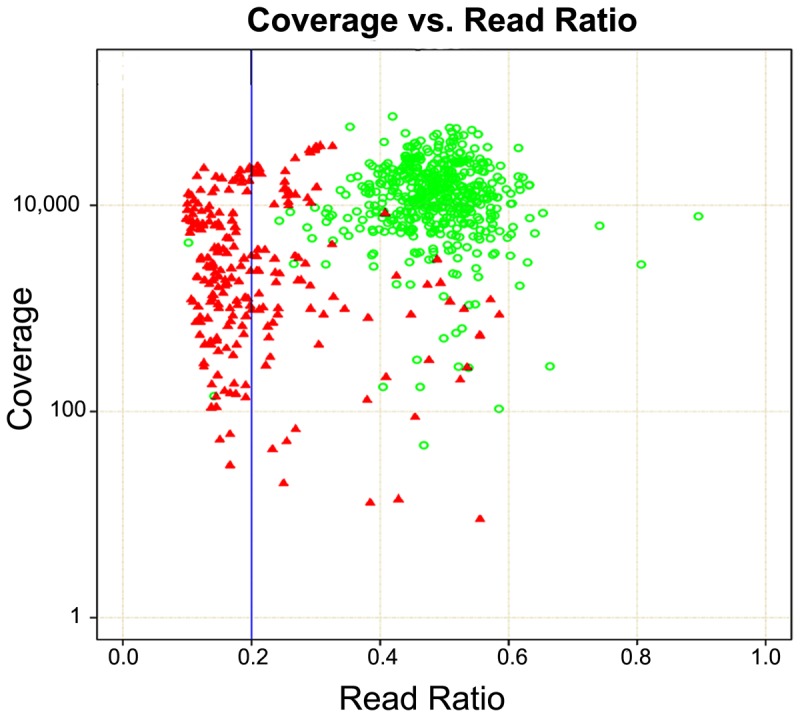
To identify the profile of false positives, sequencing coverage was plotted against the heterozygous read ratios using Sanger sequencing confirmed NGS variants. Green circle, Sanger confirmed variants. Red triangle, Sanger cleared false positive.