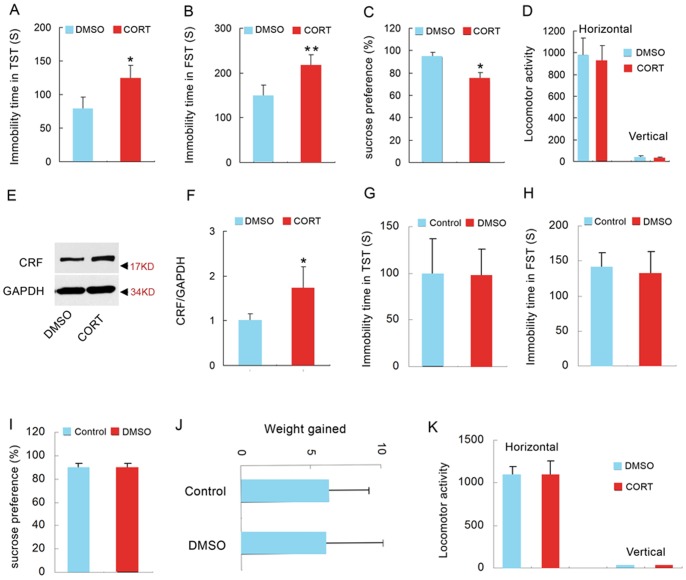
Figure 2. High concentration of glucocorticoids is sufficient to induce depressive behaviors and hyperactivity of HPA axis.
(A) Immobility time in the TST after 28 days CORT treatment (40 mg/kg/d, s.c.) (n = 14 for each group). (B) Immobility time in the FST 28 days CORT treatment (40 mg/kg/d, s.c.) (n = 14 for each group). (C) Sucrose preference of mice 28 days CORT treatment (40 mg/kg/d, s.c.) (n = 14 for each group). (D) Locomotor activity of the mice 28 days CORT treatment (40 mg/kg/d, s.c.) (n = 14 for each group). (E) Representative western blotting of CRF and GAPDH in the hypothalamus of mice treated with CORT (40 mg/kg/d s.c.) or DMSO for 28 d (n = 5 for each group) and (F) the statistical data of the western blotting experiment. Arrow heads indicate the location of nearest band in the ladder. (G) Immobility time in the TST after 28 days treatment with DMSO (20 µl/g/d, s.c.) (n = 11 for each group). (H) Immobility time in the FST after 28 days treatment with DMSO (20 µl/g/d, s.c.) (n = 11 for each group). (I) Sucrose preference after 28 days treatment with DMSO (20 µl/g/d, s.c.) (n = 11 for each group). (J) Increased weight of mice after 28 days treatment with DMSO (20 µl/g/d, s.c.) (n = 11 for each group). (K) Locomotor activity of the mice after 28 days treatment with DMSO (20 µl/g/d, s.c.) (n = 11 for each group). Error bars denote SEM, *p<0.05, two-tailed Student's t test.

