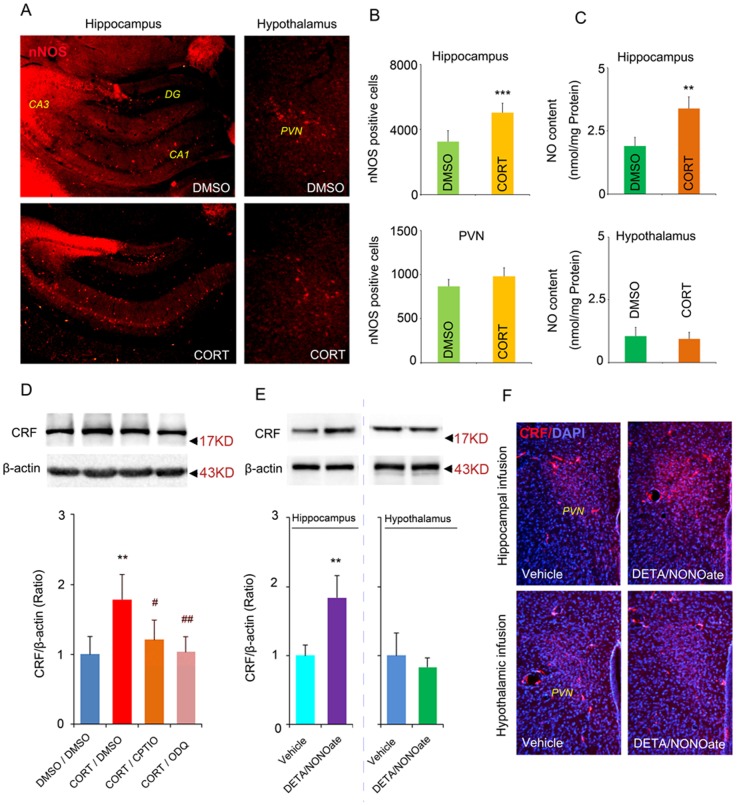
Figure 7. NO mediates the different roles of glucocorticoids in hippocampus and hypothalamus in regulating HPA axis activity.
Representative imaging of nNOS-positive cells in the hippocampus (left column) and in the PVN regions of the hypothalamus (right column) after 28 days CORT (40 mg/kg, s.c.) or DMSO treatment (A) and the number of nNOS-positive cells (B), n = 4 in DMSO group, n = 5 in CORT group. (C) The concentration of NO in the hippocampus or hypothalamus after 28 days CORT treatment (40 mg/kg, s.c.), n = 4 in DMSO group, n = 5 in CORT group. (D) Western blotting showing CRF levels in the hypothalamus at day 28 of CORT treatment with or without CPTIO or ODQ, n = 4 for each group. CORT/DMSO represented administration of CORT via s.c. plus infusion of DMSO into bilateral DG of the hippocampus, and so on. (E) Western blotting showing CRF levels in the hypothalamus 28 days after infusion of DETA/NONOate, n = 4 for each group. Infusion of DETA/NONOate into the hippocampus increased CRF expression in the hypothalamus (left). Infusion of DETA/NONOate into the PVN regions of hypothalamus did not change the CRF expression in the hypothalamus (right). Arrow heads indicate the location of nearest band in the ladder. (F) Representative imaging of CRF-positive cells (red) and DAPI-labeled cells (blue) in the hypothalamus 28 days after infusion of DETA/NONOate into the hippocampus (upper row) or hypothalamus (bottom row). Note that the CRF signal in the PVN region of the hypothalamus in mice received DETA/NONOate infusion into the hippocampus was stronger. All imaging represent 4 individual mice. Error bars denote SEM, *P<0.05, **P<0.01, ***P<0.001 compared to control group, #<0.05, ##P<0.01, compared to CORT/DMSO group, two-tailed Student's t test in (B, C, E), one-way ANOVA in (D).

