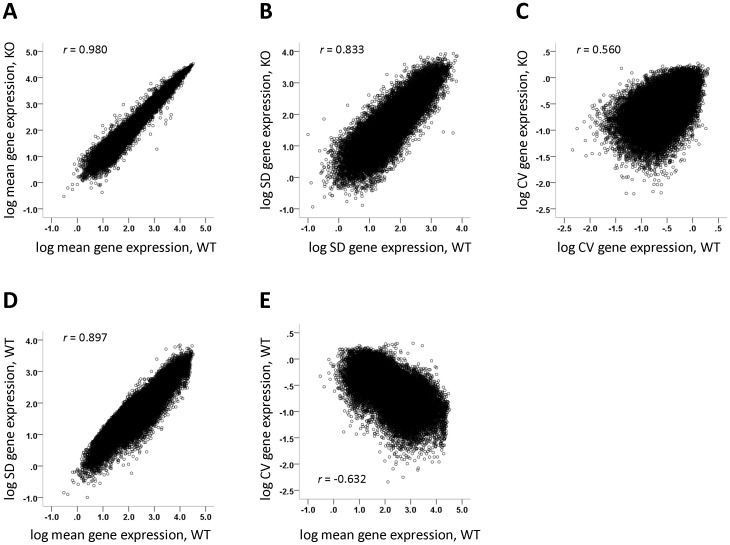
Figure 1. Relationships between sample statistics in a representative microarray dataset of gene expression in wild-type and knockout mice (#19 in Table 1).
A, Log mean gene expression (log mean value for each of the ∼45,000 probe sets on the microarray) in knockout vs. log mean in wild-type. B, Log standard deviation (SD) of gene expression in knockout vs. log SD in wild-type. C, Log CV of gene expression in knockout vs. log CV in wild-type. D, Log SD of expression vs. log mean in wild-type. E, Log CV of expression vs. log mean in wild-type. SD, standard deviation; KO, knockout; WT, wild-type; r, Pearson's correlation coefficient.

