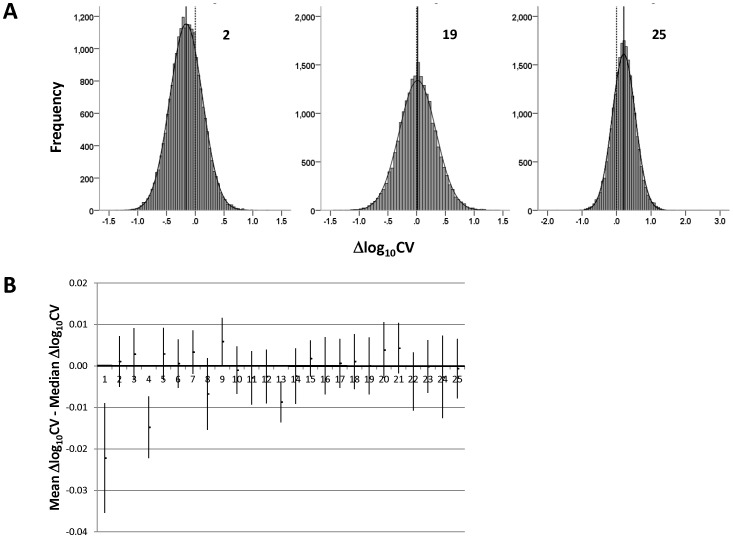
Figure 3. Characteristics of △log10 CV distributions.
A, Distribution of △log10 CV in three representative datasets (#2, #19, & #25 in Table 1). Normal curves are superimposed on the histograms; the centers of these curves indicate the positions of the means of the distributions. The solid vertical lines pass through the medians of the distributions and the dashed vertical lines through zero. B, 95% confidence intervals for the differences between the means and medians in the 25 datasets. Numbering of datasets is as in Table 1: 1, TGFBR2; 2, Pcdh12; 3, Pex5; 4, SRC-2; 5, Arx; 6, Dicer; 7, Mll; 8, Txnrd1; 9, FoxO3; 10, sirtuin 3; 11, Dicer; 12, COX-1; 13, Dicer; 14, Cryptochrome 1 & 2; 15, Phgdh; 16, MFP-2; 17, myostatin; 18, PlagL2; 19, Glycerol kinase; 20, Dicer; 21, Trim24; 22, GalT; 23, Otx2; 24, COX-2; 25, Nix. Please see the text for details.

