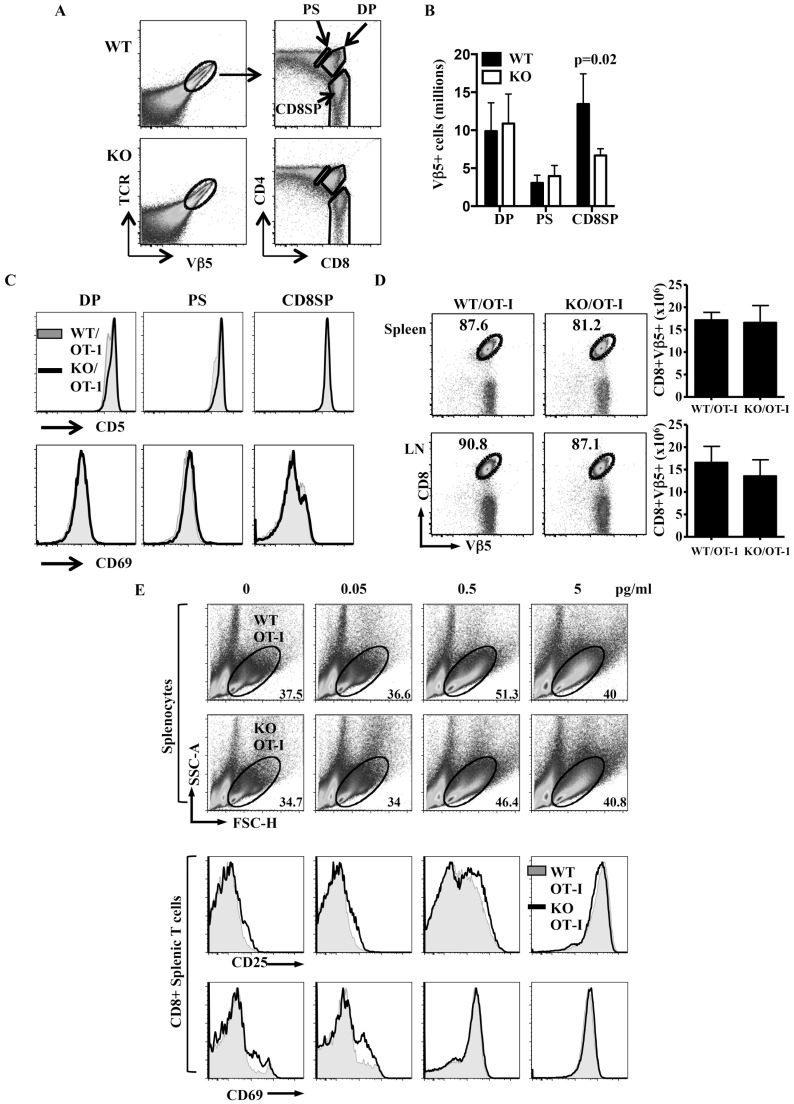
Figure 5. Itm2a regulates the thymic development but not the activation of OT-I cells.
A. Thymocytes of WT/OT-I and KO/OT-I mice were stained with anti-Vβ5, anti-α/β TCR, anti-CD4, and anti-CD8, and. representative TCR/Vβ5 FACS plots are shown in the left column. The CD4/CD8 FACS plots of TCR+Vβ5+ cells are shown in the right column. The DP, post-selected CD4+CD8dull (PS), and CD8SP populations of TCR+Vβ5+ cells are gated. B. The numbers of DP, PS, and CD8SP Vβ5+ cells were enumerated from three pairs of mice. The means and standard deviations are shown. Statistical analysis was performed with Student's t tests. C. The histograms of CD69 and CD5 of indicated Vβ5+ thymocytes of WT/OT-I and KO/OT-I mice are overlaid and shown. D. Splenocytes and lymph nodes cells of WT/OT-I and KO/OT-I mice were stained with anti-Vβ5 and anti-CD8. Representative CD8/Vβ5 FACS plots and the absolute numbers of CD8+Vβ5+ cells are shown. E. Splenocytes of WT/OT-I and KO/OT-I mice were stimulated with ovalbumin peptides at the indicated concentrations for 3 days. The percentages of live cells were determined based on the FSC/SSC gate and are shown. The cells were also stained with anti-CD25 and anti-CD69. Representative FACS plots are shown.

