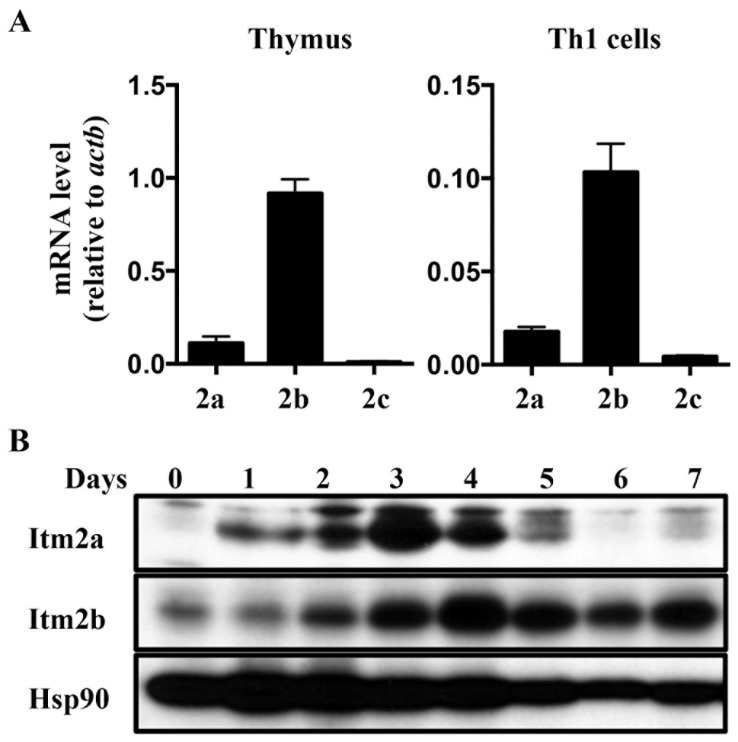
Figure 7. Potential functional redundancy between Itm2a and Itm2b.
A. The transcript level of Itm2a, Itm2b, and Itm2c in WT thymocytes and WT Th1 cells were quantified with real time PCR, and normalized against that of Actb. The means and standard deviations of three experiments are shown. B. WT naive Th cells were stimulated in vitro with anti-CD3 (1 µg/ml)/anti-CD28 (2 µg/ml). Whole cell extract was harvested at indicated time points and probed with indicated antibodies. The data shown are representative of two independent experiments.

