
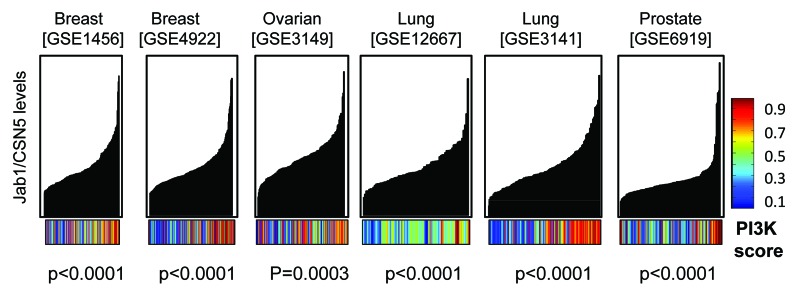
Figure 6. Increased Jab1/CSN5 levels in various tumor types correlates with elevated PI3K activity. Publically available data sets for different tumor types were downloaded from the NCBI website. Tumor data sets were sorted based on increasing Jab1/CSN5 mas5 levels. The x-axis are individual tumors, and the y-axis is relative Jab1/CSN5 mas5 levels in each tumor. A “score” for putative PI3K activity based on gene expression patterns was derived from binary regression analysis in MATLAB. PI3K scores are displayed as a color bar with blue representing low activity and red, high activity. Correlations between PI3K score and Jab1/CSN5 levels were determined by linear regression analysis using GraphPad software.