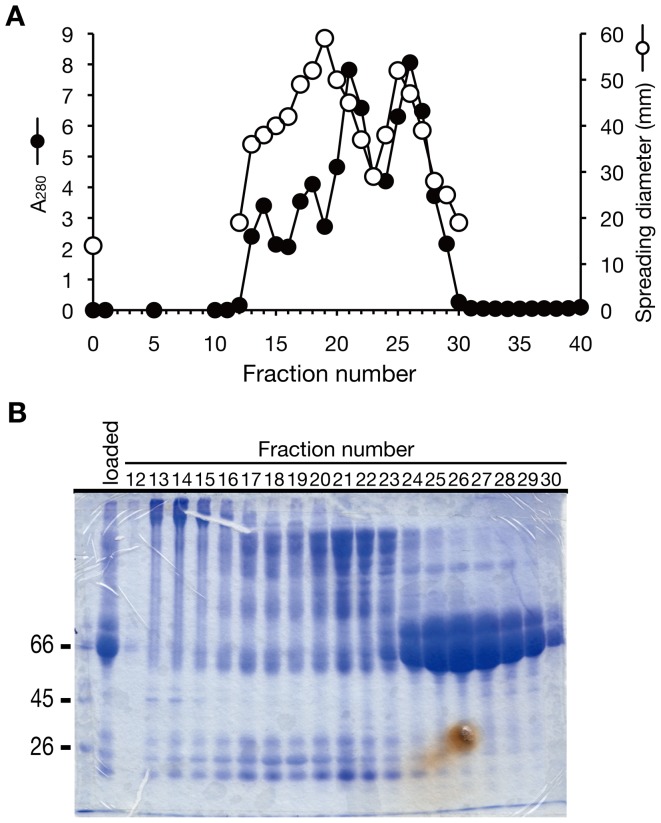
Figure 3. Gel filtration column chromatography of calf serum.
(A) Elution profile of gel filtration column chromatography using a Superdex 200. Open circles indicate diameters of colonies. Filled circles indicate absorbance at 280 nm. Molecular weight markers were eluted in the fraction described below. Catalase (250-kDa) was eluted in fraction 21, bovine serum albumin (66-kDa) in fractions 25–26, and cyanocobalamin (1.3-kDa) in fraction 38. 250-µl aliquots of each sample were applied to soft agar medium and their colony-spreading stimulatory activity was measured. (B) SDS-PAGE analysis of gel filtration fractions. The gel was stained with Coomassie Brilliant Blue. A 66-kDa protein coincided with the colony-spreading stimulatory activity in fractions 24–29.

