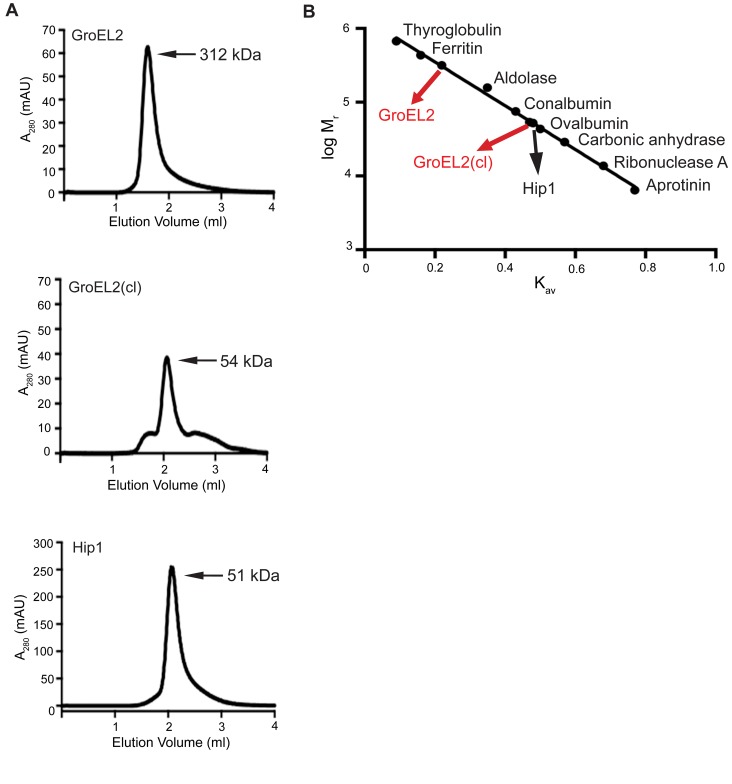
Figure 5. GroEL2 is a multimer in vitro and is converted to a monomer following cleavage by Hip1.
(A) Size exclusion chromatograms of recombinant full length GroEL2, cleaved GroEL2 and Hip1. (B) Standard curve based on the elution profiles of a set of standard molecular weight marker proteins. The logarithms of the molecular weights (log Mr) were plotted as a function of Kav. Data are shown as one representative experiment from three independent experiments.

