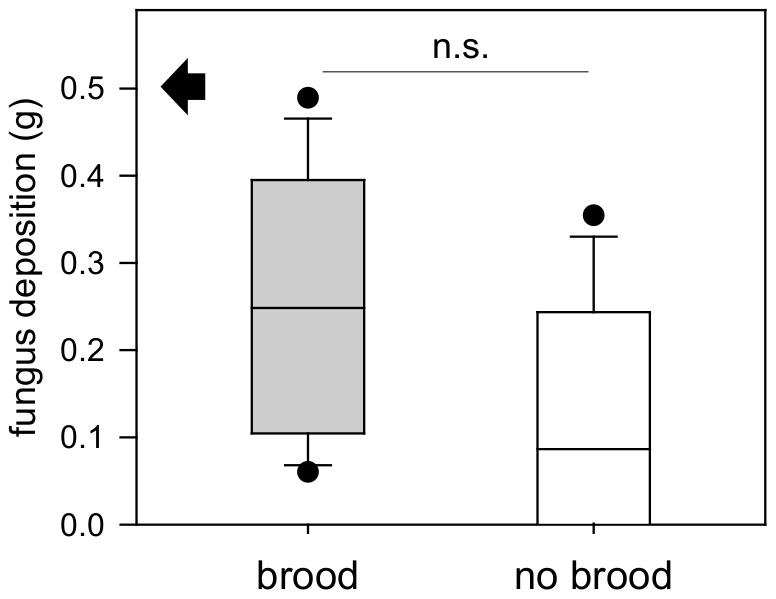
Figure 5. Experiment 6: Fungus deposition at nest sites (median ± 25–75% percentiles, min max values and outliers, n = 15); black arrow indicates maximum possible fungus deposit; n.s. = not significant, p>0.05 (Analysis of colony effects: Kruskal-Wallis test; brood site; H = 1.94; p = 0.38; n = 5; non-brood site; H = 2.2; p = 0.33; n = 5; n.s.; no colony effects found).

