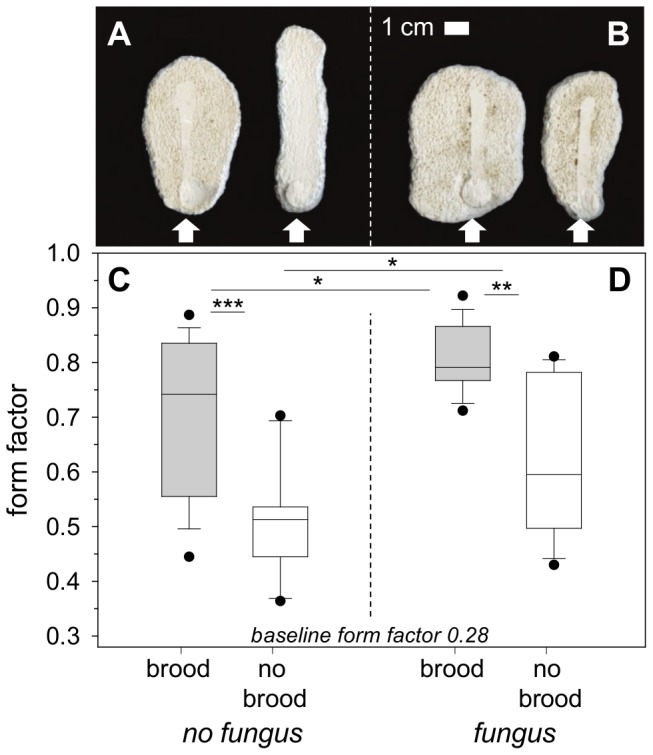
Figure 7. Evaluation of excavated shapes.

(a) Plaster molds of excavation, brood only series (Experiment 5), Arrows indicate the direction of entering ants; view from below. (b) Plaster molds of excavation, brood and fungus series (Experiment 6). (c) Calculated form factor of brood only series (Analysis of colony effects: ANOVA; brood site; F = 0.71; p = 0.5; n = 5; non-brood site; F = 0.14; p = 0.87; n = 5; n.s.; no colony effects found). (d) Calculated form factor of brood and fungus series (Analysis of colony effects: ANOVA; brood and fungus site; F = 1.24; p = 0.32; n = 5; fungus site; F = 1.67; p = 0.23; n = 5; n.s.; no colony effects found). The y-axis starts from a baseline form factor of 0.28 (preformed structure: entrance hole and tunnel) (median ± 25–75% percentiles, min max values and outliers, n = 15), *p≤0.05; **p<0.01; ***p<0.001.
