
Table 2.
Comparative results of follow-up recommendations in Korea, Japan and United States
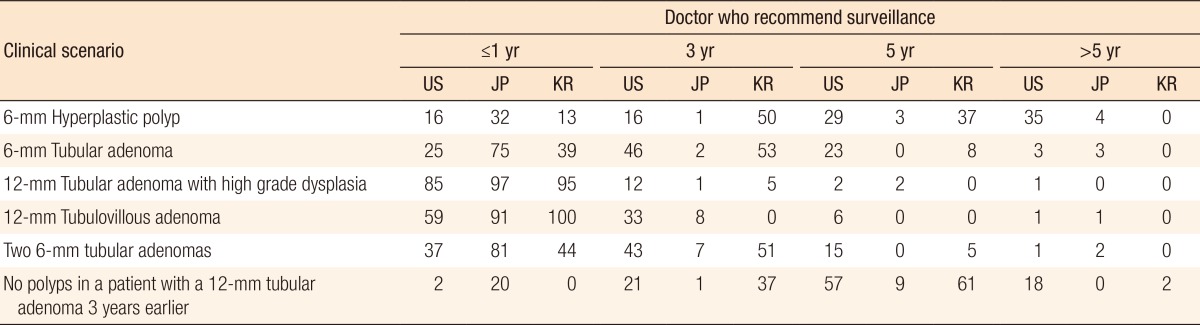
Values are presented as percentage.
US, United States (n=568); JP, Japan (n=131); KR, Korea (n=38 to 40).
Official websites use .gov
A
.gov website belongs to an official
government organization in the United States.
Secure .gov websites use HTTPS
A lock (
) or https:// means you've safely
connected to the .gov website. Share sensitive
information only on official, secure websites.
Comparative results of follow-up recommendations in Korea, Japan and United States
Values are presented as percentage.
US, United States (n=568); JP, Japan (n=131); KR, Korea (n=38 to 40).