Fig. 1.

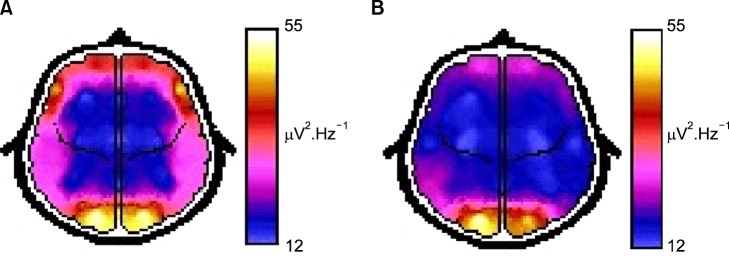
Representative mean absolute spectral power brain maps from a control subject (A) and a schizophrenic patient (B) with an increased values.

Representative mean absolute spectral power brain maps from a control subject (A) and a schizophrenic patient (B) with an increased values.