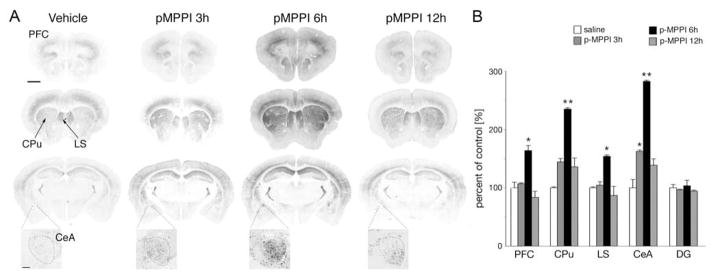
Figure 4. Treatment with the 5-HT1A receptor antagonist p-MPPI causes a robust induction of d4EGFP.

(A) Representative images of d4EGFP labeling in brain sections from control (vehicle) and p-MPPI treated animals reveal modest induction in the central nucleus of amygdala at 3 hours and robust induction in the prefrontal cortex, caudate putamen, lateral septum and the central nucleus of amygdala at 6 hours post p-MPPI injection. The level of d4EGFP expression returned to baseline at 12 hours. At each time point, three coronal sections taken approximately at +1.8, +0.9, and −1.58 mm from Bregma (order from top to bottom) are shown. Zoom-in regions show the central nucleus of amygdala (lateral subdivision of the central nucleus of amygdala is outlined). Scale bar for all large sections = 1 mm (upper left image); scale for enlarged CeA images = 100μm. (B) Quantification of d4EGFP-positive neurons, as percent change from control (vehicle treated) animals (% mean ± SD): PFC = 100 ± 9.6; 107.0 ± 1.7; 163.7 ± 8.8; 83.5 ± 10.5; CPu = 100 ± 14.1; 144.5 ± 7.5; 234.8 ± 0.2; 136.0 ± 5.7; LS =100 ± 1.6; 104.5 ± 5.8; 154.0 ± 2.3; 86.8 ± 15.2; CeA = 100 ± 14.3; 162.3 ± 2.4; 282.4 ± 2.0; 138.8 ± 10.9; DG = 100 ± 5.5; 96.5 ± 1.2; 103.5 ± 9.5; 94.3 ± 1.7. Abbreviations: CeA – central nucleus of amygdala. CPu – caudate putamen, LS – lateral septum, PFC – prefrontal cortex, DG – dentate gyrus. Statistical significance * p < 0,05, ** p<0.01 (One way ANOVA).
