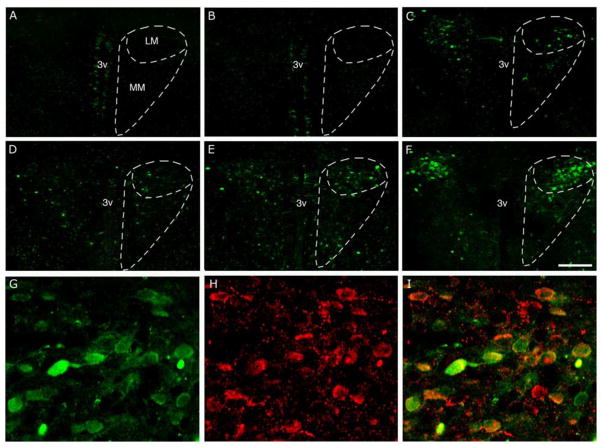
Figure 6. Induction of d4EGFP in the hypothalamic paraventricular nucleus (PVN) in different stress paradigms.
Representative images of coronal hypothalamic sections are shown from (A) naïve control mouse, (B) after single restraint stress, (C) after repeated restraint stress, (D–E) after LPS administration at 3 and 6 hrs, respectively, and (F) after combined restrain and LPS treatment. Note the increase in the number of d4EGFP-positive cells after different repeated stress paradigms (C–F). White dashed lines outline medial and lateral magnocellular subdivisions of the PVN. The d4EGFP signal (G) overlaps with corticotropin-releasing hormone immunoreactivity (H) in the majority of d4EGFP-positive neurons as seen on a single-plane confocal image (I). Scale bars = 200μm (panels A–F), 40 μm (panels G–I). Abbreviations: 3v – third ventricle, LM and MM - lateral and medial magnocellular subdivisions of the PVN (Paxinos and Franklin, 2003).

