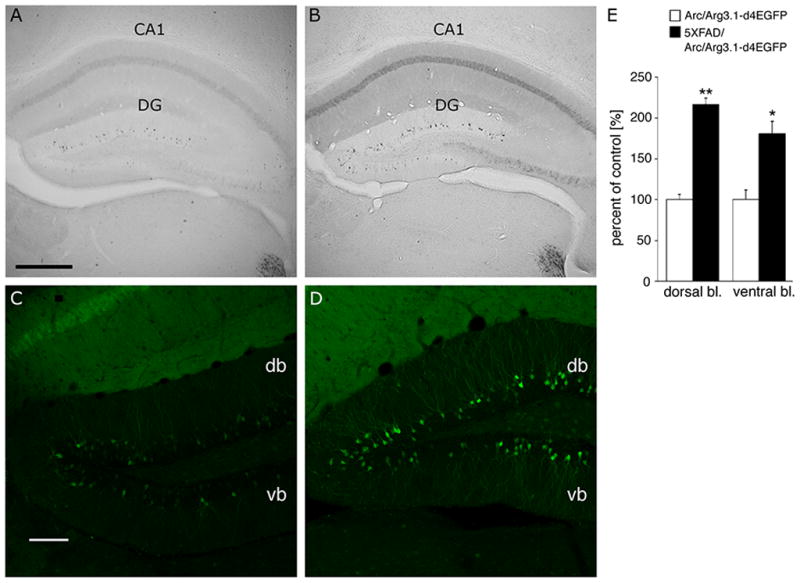
Figure 8.

Increased d4EGFP expression in a mouse model of Alzheimer’s disease Representative images of DG hippocampus (coronal sections) from one month-old TgArc/Arg3.1-d4EGFP and Tg5XFAD/TgArc/Arg3.1-d4EGFP littermate mice are shown after visualization of d4EGFP by DAB (A, B) or immunofluorescence (C,D). Note the increased number of and labeling intensity of d4EGFP-positive neurons in CA1 (B) and DG granule cells (B, D) in the Tg5XFAD/TgArc/Arg3.1-d4EGFP mice. Brain sections stained with anti-GFP antibody and visualized by biotinylated (DAB method) or FITC-conjugated secondary antibodies. The fluorescent images are single confocal scans. Abbreviations: db – dorsal blade of DG, vb – ventral blade of DG; scale bars = 250 μm (A,B) and 100 μm (C,D). (E) Count of d4EGFP-positive neurons in Tg5XFAD/TgArc/Arg3.1-d4EGFP mice, as percent change from control TgArc/Arg3.1-d4EGFP littermates, in the DG: (% mean ± SD): 216.3 ± 7.7 vs. 100 ± 6.4 (**p < 0.002) in the dorsal blade, and 180.4 ± 15.3 vs. 100 ± 11.6 (*p < 0.03) in the ventral blade.
