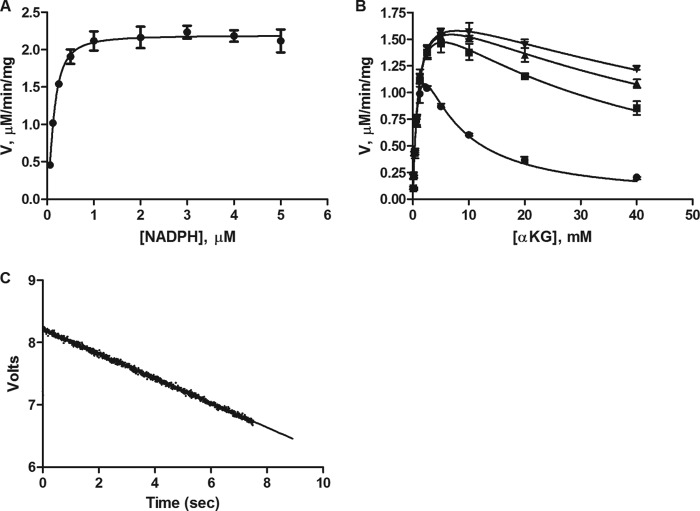
FIGURE 4.
Characterization of binding affinity of the substrate α-KG and co-factor NADPH. A, Km(app) determination for NADPH. [IDH1 R132H] = 5 nm; [α-KG] = 2 mm. [NADPH] as shown on x-axis of the graph. B, relief of α-KG substrate inhibition by increasing concentrations of the co-factor NADPH at 1 μm (circles), 5 μm (squares), 10 μm (triangles), and 20 μm (inverted triangles). [IDH1 R132H] = 5 nm; [α-KG] as shown on the x-axis of the graph. Data were fit to an allosteric sigmoidal binding model with substrate inhibition model. Error bars for A and B are mean ± S.D. from triplicate experiments. C, typical stopped-flow reaction trace. [IDH1 R123H] = 5 nm; [α-KG] = 2 mm and [NADPH] = 100 μm. Note that in this experiment, the NADPH and the enzyme were premixed for 60 min in one syringe and the α-KG was premixed in a second syringe. This pre-equilibration was done for all experiments as appropriate for the assay setup.

