
FIGURE 5.
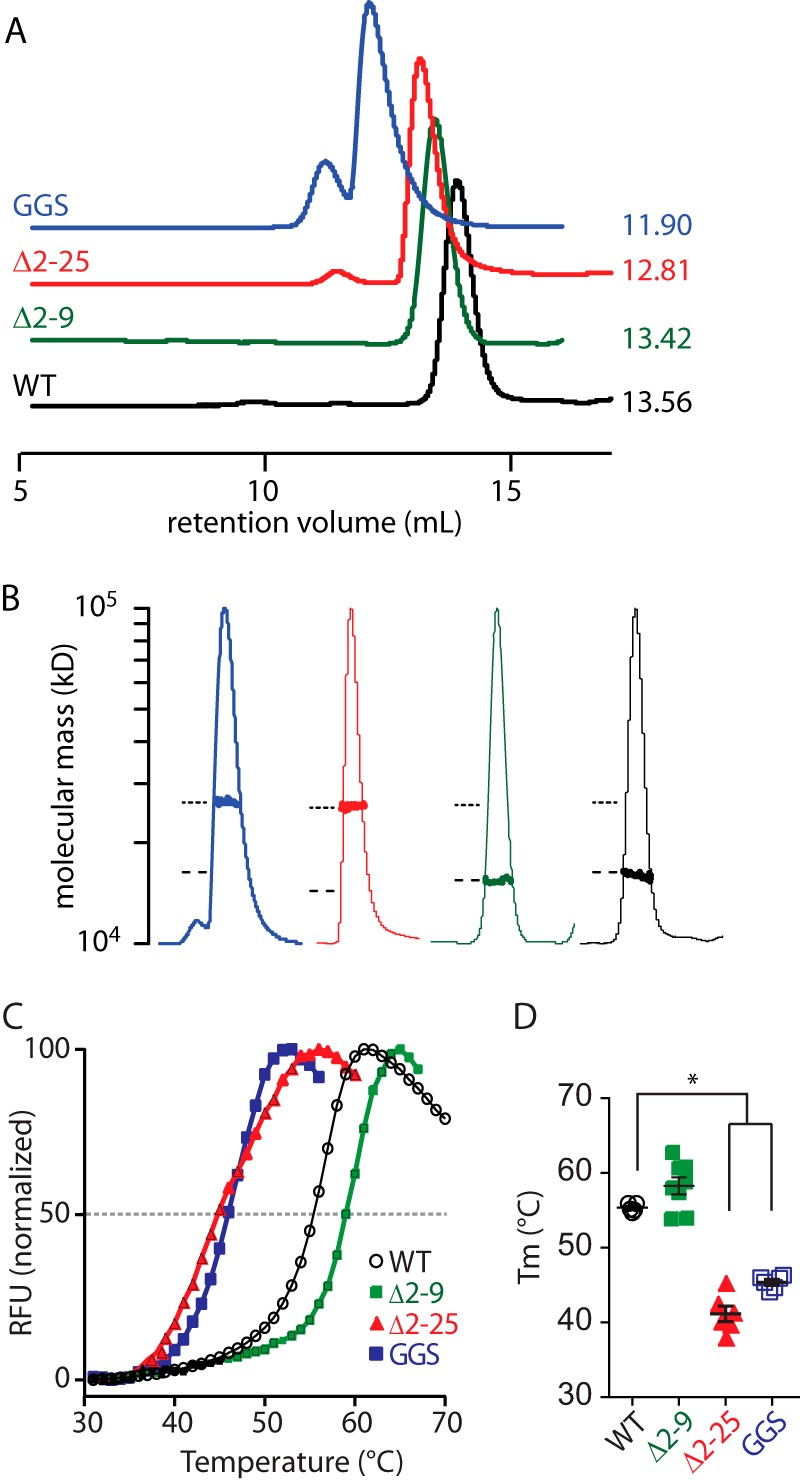
Role of the PAS domain N-Cap on the stability of the isolated Kv11.1a PAS domain. A, size exclusion chromatograms of WT (1–135, black) and mutant PAS (Δ2–9, green; GGS, blue; and Δ2–25, red) domains. Elutions were monitored by absorption at 280 nm. The retention volume for each peak is indicated next to the chromatogram. B, molecular weight of each PAS domain construct was measured using size exclusion chromatography-multiangle laser. The peak region of the normalized UV trace for each PAS domain is shown (thin lines, identical colors to A), and the measured molecular weight (bold lines) is plotted on a log scale for the peak region. The dashed and dotted lines indicate the expected molecular masses for a monomer and dimer. C, fluorescence traces of thermal stability assays for isolated Kv11.1a PAS domain proteins. The midpoint of the increasing fluorescence phase was determined as the melting temperature (Tm) of the protein, as indicated by dashed line. RFU, relative fluorescence unit. D, summary of Tm (mean ± S.E., n = 6–8) for mutant Kv11.1a PAS domains in comparison with WT Kv11.1a PAS domain. * indicates p < 0.05.