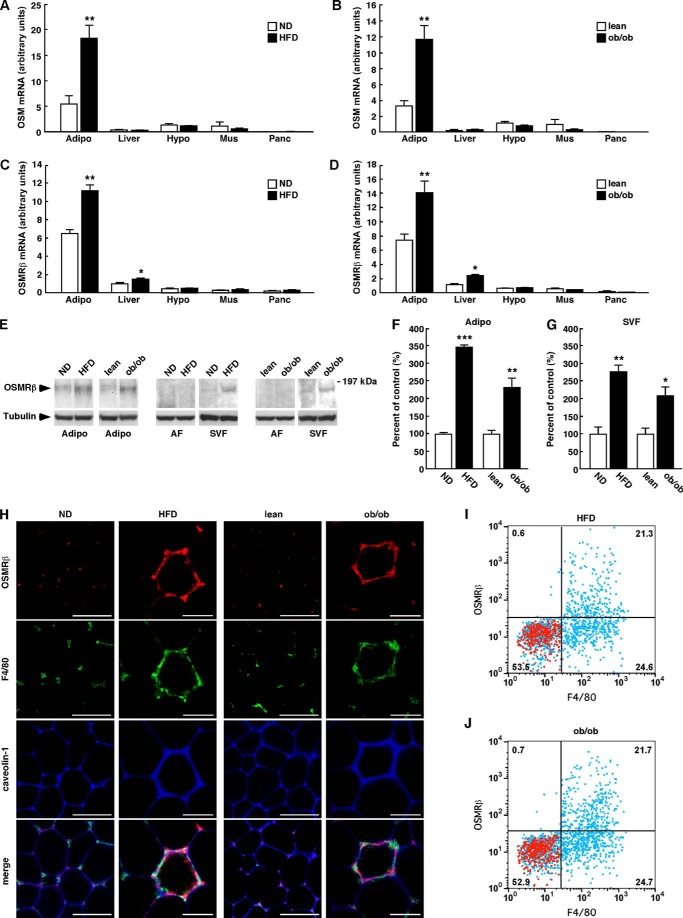
FIGURE 1.
The expressions of OSM and OSMRβ in various tissues of non-obese and obese mice. A and B, the mRNA expressions of OSM in the adipose tissue, liver, hypothalamus, skeletal muscle, and pancreas in the WT mice fed a normal diet (ND) or a HFD (A) and the lean and ob/ob mice (B) (n = 6). C and D, the mRNA expressions of OSMRβ in the adipose tissue, liver, hypothalamus, skeletal muscle, and pancreas in the WT mice fed a ND or an HFD (C) and the WT and ob/ob mice (D) (n = 6). E, Western blot analysis of OSMRβ in the adipose tissues of the non-obese and obese mice. The apparent molecular masses are indicated on the right. Bands corresponding to OSMRβ were detected at 180 kDa. F and G, a quantitative analysis of the protein expression of OSMRβ in the entire adipose tissue specimen (F) and SVF (G) (n = 6). H, immunofluorescence staining for OSMRβ (red) with F4/80 (green) and caveolin-1 (blue) in the adipose tissues of the obese mice and the respective controls. Scale bar = 100 μm. I and J, the expression of OSMRβ and F4/80 in SVF cells analyzed by flow cytometry. Isolated SVF cells from the adipose tissue of DIO (I) and ob/ob mice (J) were stained with antibodies against F4/80 and OSMRβ (blue dots). Red dots show the data with their control antibodies (n = 4). ND, C57BL/6J mice fed a normal diet at 16 weeks old; HFD, C57BL/6J mice fed an HFD for 8 weeks started at 8 weeks old; lean, control for ob/ob mice at 8 weeks old; ob/ob, ob/ob mice at 8 weeks old; Adipo, adipose tissue; AF, adipocyte fraction; Hypo, hypothalamus; Mus, skeletal muscle; Panc, pancreas. The data represent the mean ± S.E. *, p < 0.05; **, p < 0.01; ***, p < 0.005 normal diet (ND) versus HFD or lean versus ob/ob, Student's t test.

