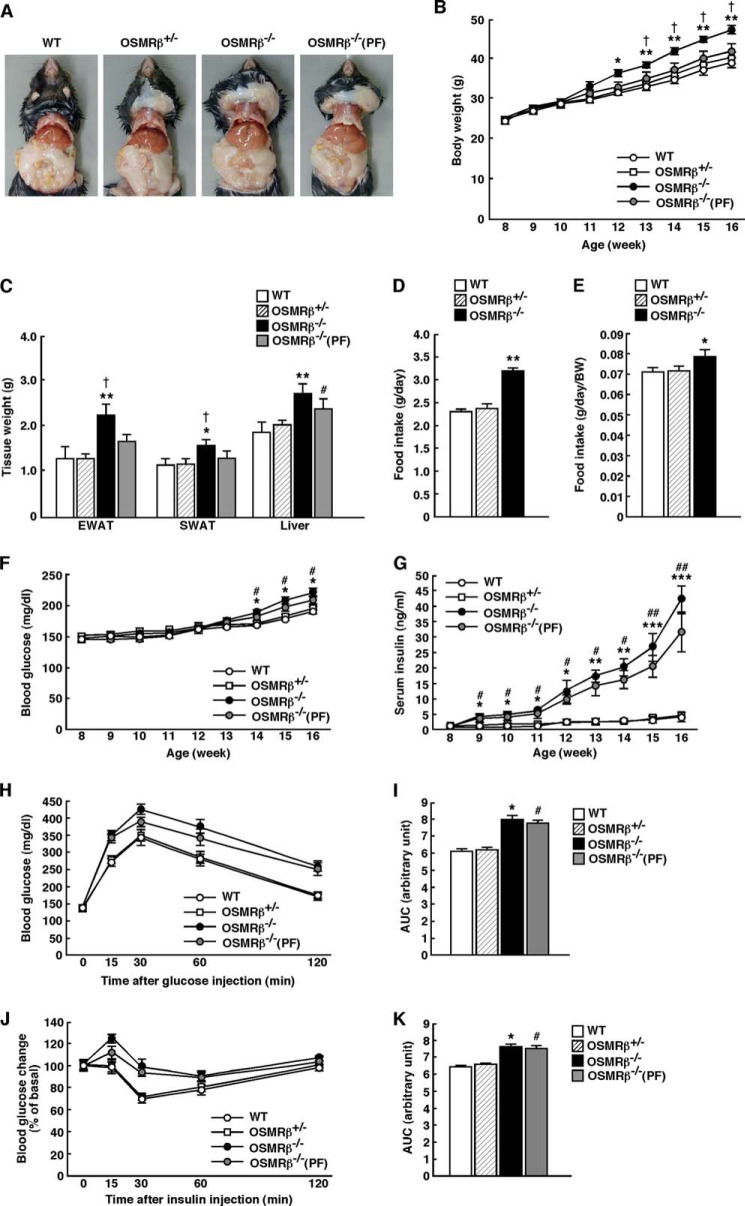
FIGURE 2.
Body weight and glucose metabolism in WT and OSMRβ−/− mice under HFD conditions. The mice (8 weeks old) were fed an HFD for 8 weeks. A, representative images of WT mice, OSMRβ+/− mice, OSMRβ−/− mice, and OSMRβ−/− mice pair-fed with WT mice (PF). B, the body weights of WT, OSMRβ+/−, OSMRβ−/−, and OSMRβ−/−(PF) mice (n = 6–11). C, the tissue weights in WT, OSMRβ+/−, OSMRβ−/−, and OSMRβ−/−(PF) mice at 8 weeks on the HFD (n = 6–11). EWAT, epididymal white adipose tissue; SWAT, subcutaneous white adipose tissue. D, the amount of food intake in WT, OSMRβ+/−, OSMRβ−/−, and OSMRβ−/−(PF) mice at 8 weeks on the HFD (n = 6–11). E, the amount of food intake per body weights in WT, OSMRβ+/−, OSMRβ−/−, and OSMRβ−/−(PF) mice at 8 weeks on the HFD (n = 6–11). F and G, the blood glucose (F) and serum insulin (G) levels in WT, OSMRβ+/−, OSMRβ−/−, and OSMRβ−/−(PF) mice in the fed state (n = 6). In the fed states, mice were fasted for 4 h before the experiments to eliminate the feeding effects on glucose metabolism. H–K, the results of the ipGTTs (H) and ITTs (J) in WT, OSMRβ+/−, OSMRβ−/−, and OSMRβ−/−(PF) mice at 8 weeks on the HFD (n = 6). For ipGTTs, mice were fasted for 16 h and intraperitoneally injected with d-glucose (1 g/kg of body weight). For ITTs, mice were fasted for 4 h and intraperitoneally injected with insulin (1 unit/kg of body weight). The AUC for blood glucose on the ipGTTs (I) and ITTs (K) is shown. The data represent the mean ± S.E. *, p < 0.05; **, p < 0.01; ***, p < 0.005 WT versus OSMRβ−/− mice; #, p < 0.05; ##, p < 0.01 WT versus OSMRβ−/−(PF) mice; †, p < 0.05 OSMRβ−/− versus OSMRβ−/−(PF) mice, analysis of variance followed by the post-hoc Bonferroni test (B, F, and G); Student's t test (C, D, E, I, and K).

