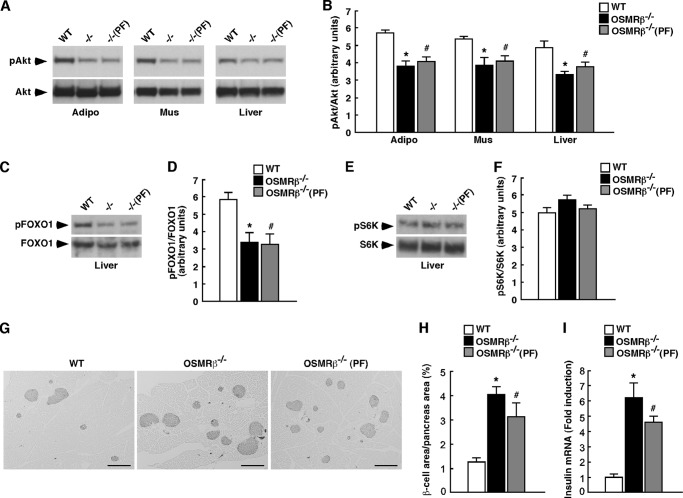
FIGURE 5.
Insulin signaling pathways in WT and OSMRβ−/− mice at 8 weeks on the HFD. After 24 h of fasting, mice were intraperitoneally injected with insulin (10 milliunits/g of body weight) and maintained for 10 min. A, insulin-stimulated Akt phosphorylation in the adipose tissues, skeletal muscles, and livers of WT, OSMRβ−/−, and OSMRβ−/−(PF) mice (n = 6). B, a quantitative analysis of pAkt (n = 6). C–F, insulin-stimulated phosphorylation of FOXO1 (pFOXO1) (C) and S6K (pS6K) (E) in the livers of WT, OSMRβ−/−, and OSMRβ−/−(PF) mice. A quantitative analysis of pFOXO1 (D) and pS6K (F) (n = 6) is shown. G, immunohistochemistry for insulin in the pancreas of WT, OSMRβ−/−, and OSMRβ−/−(PF) mice. Scale bars = 500 μm. H, quantitative analysis of the area of β-cells in the total area of the pancreas. I, the mRNA expression of insulin in the pancreas of WT, OSMRβ−/−, and OSMRβ−/−(PF) mice in the fed states. Adipo, adipose tissue; Mus, skeletal muscle. The data represent the mean ± S.E. *, p < 0.05 WT versus OSMRβ−/− mice; #, p < 0.05 WT versus OSMRβ−/−(PF) mice; Student's t test.

