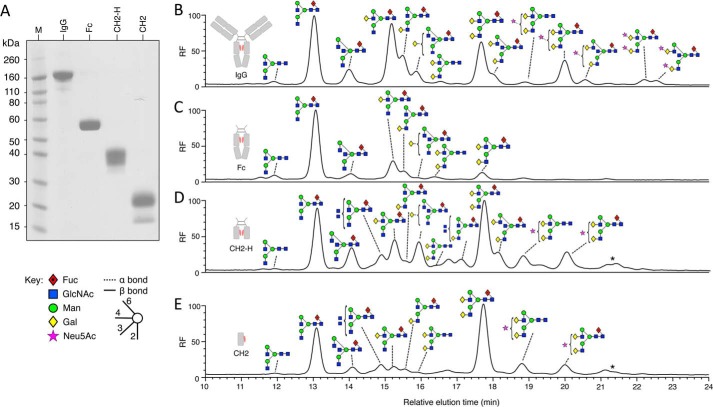
FIGURE 1.
Glycosylation profiling of serum IgG and recombinantly expressed IgG fragments. Shown is SDS-PAGE analysis of serum IgG and purified IgG fragments (A). Shown is HPLC analysis of fluorescently labeled glycans released from serum IgG (B) and recombinantly expressed Fc (C), CH2-H (D), and CH2 (E) using PNGase F. Peaks were assigned using negative ion electrospray ionization-MS/MS and are labeled using Oxford glycan nomenclature (46) with the color scheme of the Consortium for Functional Glycomics as previously implemented (20, 47). The star denotes glycan with the composition Neu5Ac2Hex5GlcNAc4 (probably Neu5Ac2Gal2GlcNAc2Man3GlcNAc2), which was present in too low a quantity for fragmentation analysis. Fluorescence is reported as relative fluorescence units (RF).

