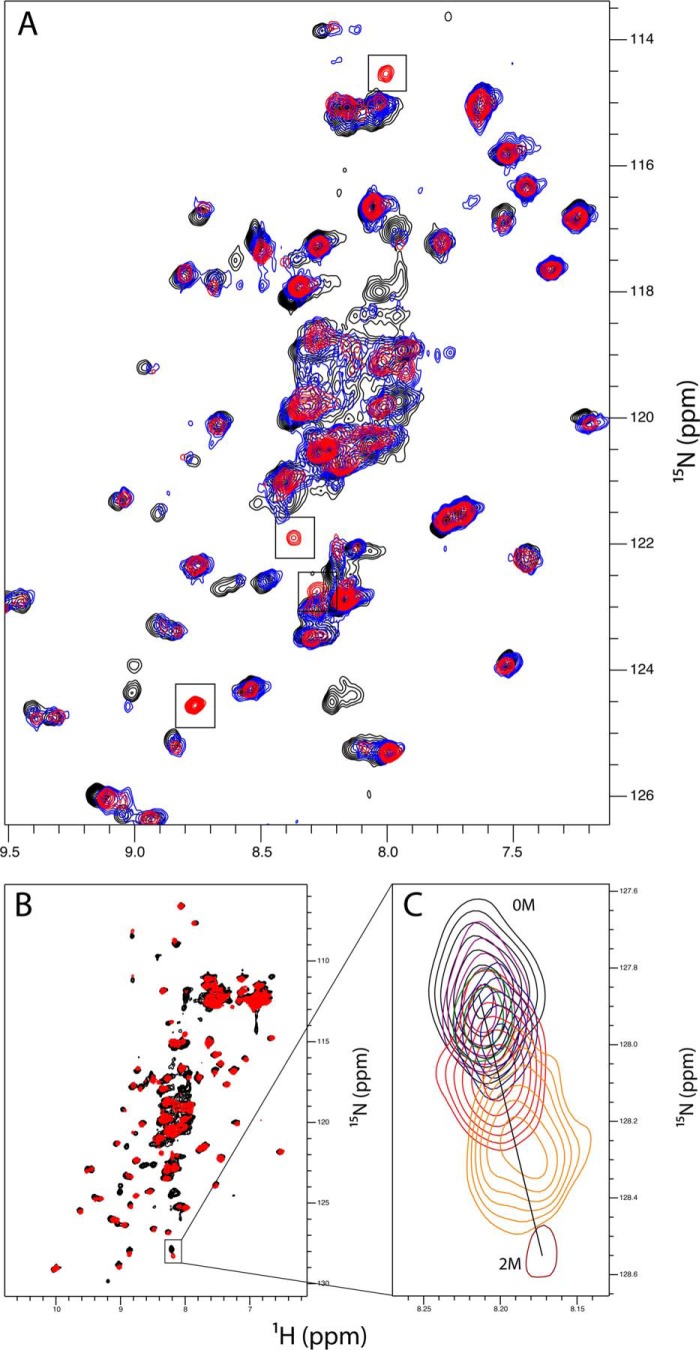
FIGURE 6.
NMR analysis of the CBM in the presence of monosaccharides. A magnified region of the 15N HSQC spectra is shown for the untreated CBM (black) and the CBM titrated with 1 m d-galactose (red) or 1 m l-fructose (blue). The four peaks, which are unique to the d-galactose-treated sample, are indicated by black boxes (A). The complete 15N HSQC spectra for untreated CBM (black) and CBM with 1 m d-galactose (red) show nonspecific chemical shift perturbations upon the addition of d-galactose (B) with a magnification of one such example over the titration points of 0 mm, 62.5 mm, 125 mm, 250 mm, 500 mm, 1 m, and 2 m d-galactose.

