FIGURE 7.
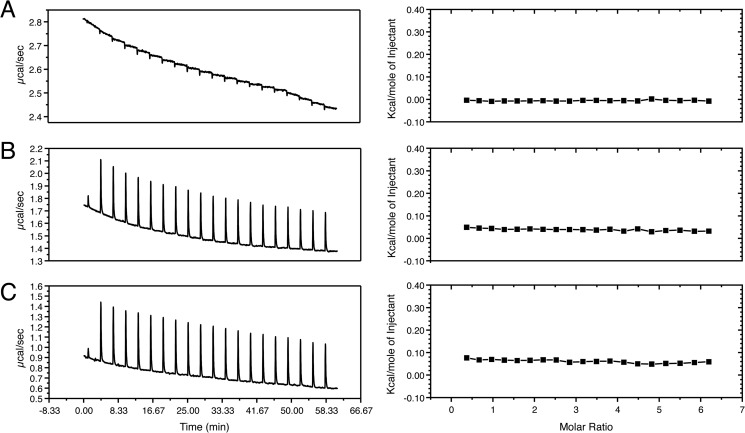
Isothermal calorimetry titrations of the CBM with d-galactose. The left-hand panels indicate the raw data collected during titration of the CBM with d-galactose. The right-hand panels show the corresponding enthalpy changes of the integrated peaks plotted as the change in kcal/mole of injectant (PBS or d-galactose) versus the molar ratio of CBM to d-galactose. The titration of d-galactose into PBS shows a negligible exothermic change in enthalpy attributable to the heat of dilution of the d-galactose solution into PBS (A). The titration of d-galactose into a solution of CBM gives endothermic changes in enthalpy at each injection point (B). The titration of PBS into a solution of CBM also shows endothermic changes in enthalpy at each injection point, comparable to those that occur upon the addition of d-galactose (C). None of the titrations give an isotherm curve indicative of a binding event (right-hand panels).

