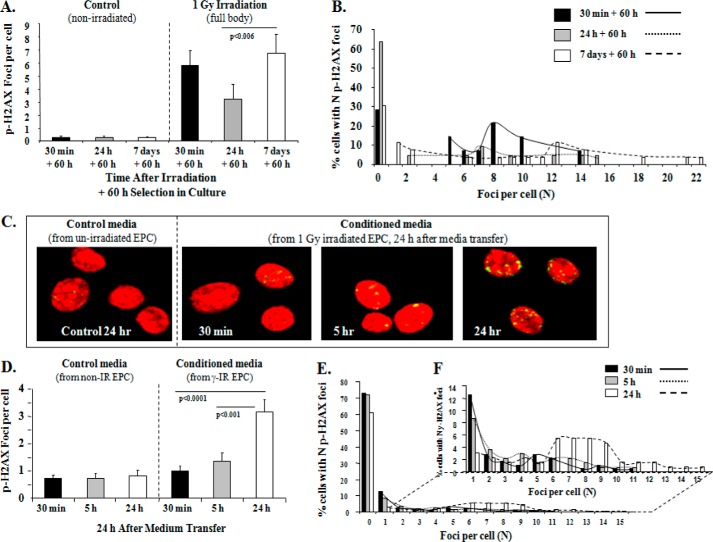
FIGURE 2.
Slow decay and increased p-H2AX foci in ex vivo EPCs by day 7 after full body 1 Gy γ-irradiation and increased bystander responses demonstrated by BM-EPCs in vitro with increase in mean p-H2AX foci/cell over time. A, graphic representation of mean p-H2AX foci/cell after 60 h in the selective EPC culture media from WT mice at 30 min (black bars), 24 h (gray bars), and 7 days (white bars) after full body irradiation with 1 Gy γ-IR compared with respective N-IR controls. In control N-IR ex vivo expanded EPCs, there was no change over 7 days in p-HA2X foci: 0.27 ± 0.15 versus 0.27 ± 0.15 and 0.29 ± 0.08, p = NS, all comparisons. Graphs represent data pooled from three independent biological samples treated under similar conditions. B, foci distribution plot of percentage of WT EPCs with an N of p-H2AX foci for 30 min, 24 h, and 7 days post-IR treatment. C, representative images for p-H2AX immunostaining (yellow) and Topro-3-stained nuclei (red) in naïve WT EPCs in vitro, treated with IR-CM medium transferred at 30 min, 5 h, and 24 h post-IR of WT EPCs with 1-Gy γ-IR compared with respective controls after 24 h treatment with CM. D, graphic representation of mean p-H2AX foci/cell after 24-h treatment of naïve WT EPCs with IR-CM medium from WT EPCs at 30 min (black bars), 5 h (gray bars), and 24 h (white bars) after 1-Gy γ-IR. In control N-IR CM-treated EPCs, there was no change over 24 h in p-HA2X foci: 0.7 ± 0.1 versus 0.8 ± 0.2 and 0.8 ± 0.2, p = NS, all comparisons. In IR-CM-treated EPCs, there was a significant increase in p-H2AX foci when comparing 30 min versus 24 h: 1 ± 0.2 versus 3.2 ± 0.5, p < 0.0001, and 5 h versus 24 h 1.4 ± 0.3 versus 3.2 ± 0.46, p < 0.001. The graphs represent data pooled from three independent biological samples treated under similar conditions. E, foci distribution plot of percentage of naïve WT EPCs after IR-CM transfer with a given number (N) of foci count from 0–15 foci for 30-min, 5-h, and 24-h treatment conditions. F, for better visualization of distribution of EPCs with N foci, the graph provided shows the distribution after excluding the cells with 0 foci (1–15 foci).

