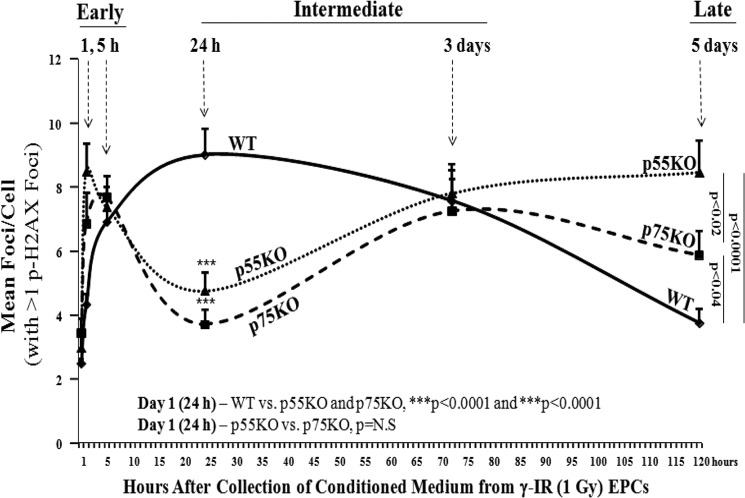
FIGURE 3.
TNF ligand-receptor interactions modify formation of p-H2AX foci in BM-EPCs in vitro. The analysis of p-H2AX formation and decay was performed for every time point where we included all cells with ≥1 p-H2AX foci and mean foci/cell was plotted. Graphic representation of mean p-H2AX foci/cell 24 h after treatment of naïve WT, p55KO, and p75KO EPCs with IR-CM medium collected from respective WT, p55KO, and p75KO EPCs at 1 h, 5 h, 24 h, 3 days, and 5 days after 1-Gy γ-IR. pH2AX foci/cell treated with 1 h IR-CM in WT versus p75KO and p55KO: 4.3 ± 0.4 versus 6.9 ± 1 and 8.5 ± 0.9, p < 0.002 and p < 0.0001, respectively; pH2AX foci/cell treated with 5 h IR-CM in WT versus p75KO and p55KO: 6.9 ± 0.9 versus 7.7 ± 0.6 and 8.5 ± 0.9, p = NS, both comparisons; pH2AX foci/cell treated with 24 h IR-CM in WT versus p75KO and p55KO: 9 ± 0.8 versus 3.7 ± 0.5 and 4.8 ± 0.6, p < 0.0001, both comparisons; pH2AX foci/cell treated with 3-day IR-CM in WT versus p75KO and p55KO: 7.6 ± 0.8 versus 7.3 ± 1.5 and 7.8 ± 0.7, p = NS, both comparisons; pH2AX foci/cell treated with 5-day IR-CM in WT versus p75KO and p55KO: 3.8 ± 0.4 versus 5.9 ± 0.8 and 8.5 ± 1, p < 0.04 and p < 0.0001, as well as p < 0.03 when comparing p75KO versus p55KO. There was a steady increase over time in the formation of p-H2AX foci in N-IR p55KO treated with 1-, 3-, and 5-day IR-CM collected from corresponding genotype EPCs: 4.8 ± 0.6 versus 7.8 ± 0.7 versus 8.5 ± 1; p < 0.002 for day 1 versus day 3, p < 0.0001 for day 1 versus day 5, p = NS for day 3 versus day 5. There was a similar increase, however, followed by a decrease in p75KO EPCs: 3.7 ± 0.5 versus 7.3 ± 1.5 versus 5.9 ± 0.8: p < 0.003 for day 1 versus day 3, p < 0.04 for day 1 versus day 5, p = NS for day 3 versus day 5. The graphs represent data pooled from three independent biological samples treated under similar conditions.

