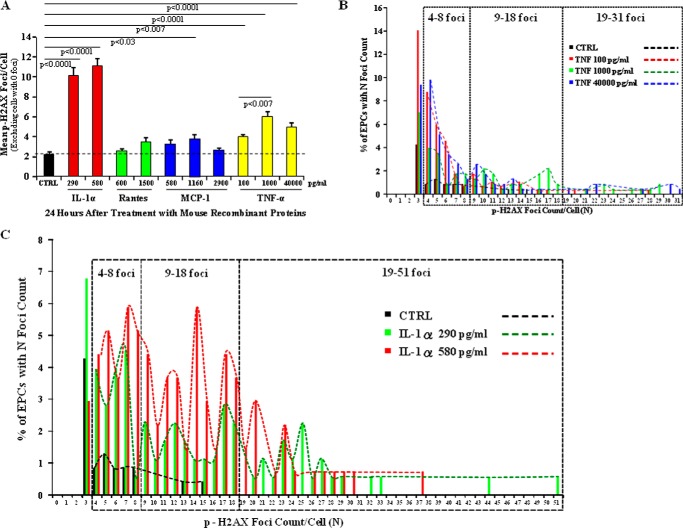
FIGURE 7.
p-H2AX foci formation increased in nonirradiated p55KO EPCs in vitro after treatment with mouse recombinant TNF-α and IL-1α. A, graphic representation of mean p-H2AX foci/cell after 24-h treatment of naïve p55KO EPCs with various concentrations of rm IL-1α (red bars), rmRANTES (green bars), rmMCP-1 (blue bars), and rmTNF-α (yellow bars) compared with control (CTRL) p55KO EPCs (black bar). The graphs represent data pooled from three identically treated independent biological samples. B, foci distribution of naïve p55KO EPCs with the number of foci (N) after treatment with various concentrations of rmTNF-α protein in vitro for 24 h. Almost 0.5–2.55% and 0.5–1% of cells treated with 100 pg/ml (red bars and dashed line), 1,000 pg/ml (green bars and dashed line), and 40,000 pg/ml (blue bars and dashed line) of TNF-α had 9–18 and 19–31 foci/cell, respectively, when compared with control p55KO EPCs (black bars and dashed line), which had no more than 0.5% cells with a maximum of 13 and 15 p-H2AX foci/cell. Treatment with 40,000 pg/ml of TNF-α resulted in a maximum of 31 foci/cell in 0.5% of EPCs. C, foci distribution of naïve p55KO EPCs with number of foci (N) upon treatment with 290 pg/ml (green bars) and 580 pg/ml (red bars) concentrations of rmIL-1α protein in vitro for 24 h. Mouse recombinant IL-1α treatment resulted in >4% of cells with 9–18 foci/cell, whereas control p55KO EPCs (black bars) had no more than 0.5% cells with a maximum of 13 and 15 p-H2AX foci/cell. At the same time, 0.5–3% of p55KO EPCs had a maximum of 19–37 foci/cell in 580 pg/ml and 19–51 foci/cell in 290 pg/ml treatment conditions.

